Slavic vs Immigrants from Haiti Male Poverty

COMPARE

Slavic
Race
Ancestry
AfghanAfricanAlaska NativeAlaskan AthabascanAlbanianAleutAlsatianAmericanApacheArabArapahoArgentineanArmenianAssyrian/Chaldean/SyriacAustralianAustrianBahamianBangladeshiBarbadianBasqueBelgianBelizeanBermudanBhutaneseBlackfeetBolivianBrazilianBritishBritish West IndianBulgarianBurmeseCajunCambodianCanadianCape VerdeanCarpatho RusynCelticCentral AmericanCentral American IndianCherokeeCheyenneChickasawChileanChineseChippewaChoctawColombianColvilleComancheCosta RicanCreeCreekCroatianCrowCubanCypriotCzechCzechoslovakianDanishDelawareDominicanDutchDutch West IndianEastern EuropeanEcuadorianEgyptianEnglishEstonianEthiopianEuropeanFijianFilipinoFinnishFrenchFrench American IndianFrench CanadianGermanGerman RussianGhanaianGreekGuamanian/ChamorroGuatemalanGuyaneseHaitianHmongHonduranHopiHoumaHungarianIcelanderIndian (Asian)IndonesianInupiatIranianIraqiIrishIroquoisIsraeliItalianJamaicanJapaneseJordanianKenyanKiowaKoreanLaotianLatvianLebaneseLiberianLithuanianLumbeeLuxembourgerMacedonianMalaysianMalteseMarshalleseMenomineeMexicanMexican American IndianMongolianMoroccanNative HawaiianNavajoNepaleseNew ZealanderNicaraguanNigerianNorthern EuropeanNorwegianOkinawanOsageOttawaPaiutePakistaniPalestinianPanamanianParaguayanPennsylvania GermanPeruvianPimaPolishPortuguesePotawatomiPuebloPuerto RicanPuget Sound SalishRomanianRussianSalvadoranSamoanScandinavianScotch-IrishScottishSeminoleSenegaleseSerbianShoshoneSierra LeoneanSiouxSlavicSlovakSloveneSomaliSouth AfricanSouth AmericanSouth American IndianSoviet UnionSpaniardSpanishSpanish AmericanSpanish American IndianSri LankanSubsaharan AfricanSudaneseSwedishSwissSyrianTaiwaneseThaiTlingit-HaidaTohono O'OdhamTonganTrinidadian and TobagonianTsimshianTurkishU.S. Virgin IslanderUgandanUkrainianUruguayanUteVenezuelanVietnameseWelshWest IndianYakamaYaquiYugoslavianYumanYup'ikZimbabwean
Immigration
NonimmigrantsImmigrantsAfghanistanAfricaAlbaniaArgentinaArmeniaAsiaAustraliaAustriaBahamasBangladeshBarbadosBelarusBelgiumBelizeBoliviaBosnia and HerzegovinaBrazilBulgariaBurma/MyanmarCabo VerdeCambodiaCameroonCanadaCaribbeanCentral AmericaChileChinaColombiaCongoCosta RicaCroatiaCubaCzechoslovakiaDenmarkDominicaDominican RepublicEastern AfricaEastern AsiaEastern EuropeEcuadorEgyptEl SalvadorEnglandEritreaEthiopiaEuropeFijiFranceGermanyGhanaGreeceGrenadaGuatemalaGuyanaHondurasHong KongHungaryIndiaIndonesiaIranIraqIrelandIsraelItalyJamaicaJapanJordanKazakhstanKenyaKoreaKuwaitLaosLatin AmericaLatviaLebanonLiberiaLithuaniaMalaysiaMexicoMicronesiaMiddle AfricaMoldovaMoroccoNepalNetherlandsNicaraguaNigeriaNorth AmericaNorth MacedoniaNorthern AfricaNorthern EuropeNorwayOceaniaPakistanPanamaPeruPhilippinesPolandPortugalRomaniaRussiaSaudi ArabiaScotlandSenegalSerbiaSierra LeoneSingaporeSomaliaSouth AfricaSouth AmericaSouth Central AsiaSouth Eastern AsiaSouthern EuropeSpainSri LankaSt. Vincent and the GrenadinesSudanSwedenSwitzerlandSyriaTaiwanThailandTrinidad and TobagoTurkeyUgandaUkraineUruguayUzbekistanVenezuelaVietnamWest IndiesWestern AfricaWestern AsiaWestern EuropeYemenZaireZimbabweAzores
Immigrants from Haiti
Race
Ancestry
AfghanAfricanAlaska NativeAlaskan AthabascanAlbanianAleutAlsatianAmericanApacheArabArapahoArgentineanArmenianAssyrian/Chaldean/SyriacAustralianAustrianBahamianBangladeshiBarbadianBasqueBelgianBelizeanBermudanBhutaneseBlackfeetBolivianBrazilianBritishBritish West IndianBulgarianBurmeseCajunCambodianCanadianCape VerdeanCarpatho RusynCelticCentral AmericanCentral American IndianCherokeeCheyenneChickasawChileanChineseChippewaChoctawColombianColvilleComancheCosta RicanCreeCreekCroatianCrowCubanCypriotCzechCzechoslovakianDanishDelawareDominicanDutchDutch West IndianEastern EuropeanEcuadorianEgyptianEnglishEstonianEthiopianEuropeanFijianFilipinoFinnishFrenchFrench American IndianFrench CanadianGermanGerman RussianGhanaianGreekGuamanian/ChamorroGuatemalanGuyaneseHaitianHmongHonduranHopiHoumaHungarianIcelanderIndian (Asian)IndonesianInupiatIranianIraqiIrishIroquoisIsraeliItalianJamaicanJapaneseJordanianKenyanKiowaKoreanLaotianLatvianLebaneseLiberianLithuanianLumbeeLuxembourgerMacedonianMalaysianMalteseMarshalleseMenomineeMexicanMexican American IndianMongolianMoroccanNative HawaiianNavajoNepaleseNew ZealanderNicaraguanNigerianNorthern EuropeanNorwegianOkinawanOsageOttawaPaiutePakistaniPalestinianPanamanianParaguayanPennsylvania GermanPeruvianPimaPolishPortuguesePotawatomiPuebloPuerto RicanPuget Sound SalishRomanianRussianSalvadoranSamoanScandinavianScotch-IrishScottishSeminoleSenegaleseSerbianShoshoneSierra LeoneanSiouxSlovakSloveneSomaliSouth AfricanSouth AmericanSouth American IndianSoviet UnionSpaniardSpanishSpanish AmericanSpanish American IndianSri LankanSubsaharan AfricanSudaneseSwedishSwissSyrianTaiwaneseThaiTlingit-HaidaTohono O'OdhamTonganTrinidadian and TobagonianTsimshianTurkishU.S. Virgin IslanderUgandanUkrainianUruguayanUteVenezuelanVietnameseWelshWest IndianYakamaYaquiYugoslavianYumanYup'ikZimbabwean
Immigration
NonimmigrantsImmigrantsAfghanistanAfricaAlbaniaArgentinaArmeniaAsiaAustraliaAustriaBahamasBangladeshBarbadosBelarusBelgiumBelizeBoliviaBosnia and HerzegovinaBrazilBulgariaBurma/MyanmarCabo VerdeCambodiaCameroonCanadaCaribbeanCentral AmericaChileChinaColombiaCongoCosta RicaCroatiaCubaCzechoslovakiaDenmarkDominicaDominican RepublicEastern AfricaEastern AsiaEastern EuropeEcuadorEgyptEl SalvadorEnglandEritreaEthiopiaEuropeFijiFranceGermanyGhanaGreeceGrenadaGuatemalaGuyanaHaitiHondurasHong KongHungaryIndiaIndonesiaIranIraqIrelandIsraelItalyJamaicaJapanJordanKazakhstanKenyaKoreaKuwaitLaosLatin AmericaLatviaLebanonLiberiaLithuaniaMalaysiaMexicoMicronesiaMiddle AfricaMoldovaMoroccoNepalNetherlandsNicaraguaNigeriaNorth AmericaNorth MacedoniaNorthern AfricaNorthern EuropeNorwayOceaniaPakistanPanamaPeruPhilippinesPolandPortugalRomaniaRussiaSaudi ArabiaScotlandSenegalSerbiaSierra LeoneSingaporeSomaliaSouth AfricaSouth AmericaSouth Central AsiaSouth Eastern AsiaSouthern EuropeSpainSri LankaSt. Vincent and the GrenadinesSudanSwedenSwitzerlandSyriaTaiwanThailandTrinidad and TobagoTurkeyUgandaUkraineUruguayUzbekistanVenezuelaVietnamWest IndiesWestern AfricaWestern AsiaWestern EuropeYemenZaireZimbabweAzores
Male Poverty
Income
Poverty
Unemployment
Labor Participation
Family Structure
Vehicle Availability
Education Level
Disability

Male Poverty Comparison

Slavs

Immigrants from Haiti

Exceptional
Tragic
10.5%
MALE POVERTY
91.7/ 100
METRIC RATING
103rd/ 347
METRIC RANK
13.8%
MALE POVERTY
0.0/ 100
METRIC RATING
284th/ 347
METRIC RANK

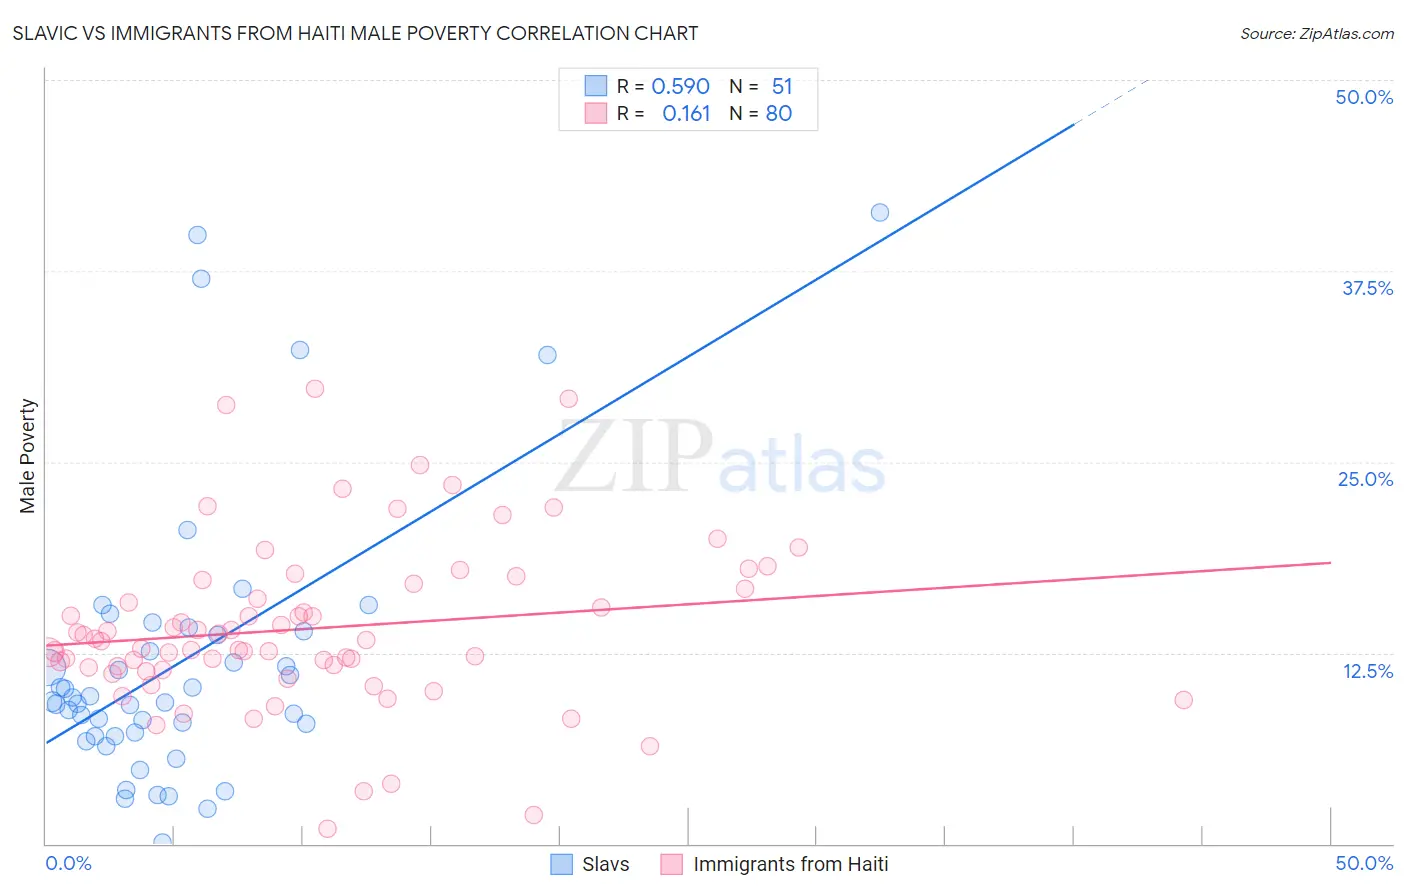
Slavic vs Immigrants from Haiti Male Poverty Correlation Chart

The statistical analysis conducted on geographies consisting of 270,742,219 people shows a substantial positive correlation between the proportion of Slavs and poverty level among males in the United States with a correlation coefficient (R) of 0.590 and weighted average of 10.5%. Similarly, the statistical analysis conducted on geographies consisting of 225,134,025 people shows a poor positive correlation between the proportion of Immigrants from Haiti and poverty level among males in the United States with a correlation coefficient (R) of 0.161 and weighted average of 13.8%, a difference of 30.6%.
Slavic vs Immigrants from Haiti Male Poverty

Male Poverty Correlation Summary

MeasurementSlavicImmigrants from Haiti
Minimum0.066%0.99%
Maximum41.3%29.8%
Range41.2%28.8%
Mean11.9%14.1%
Median9.3%13.3%
Interquartile 25% (IQ1)7.0%11.5%
Interquartile 75% (IQ3)13.9%16.9%
Interquartile Range (IQR)6.9%5.4%
Standard Deviation (Sample)9.2%5.5%
Standard Deviation (Population)9.1%5.5%

Similar Demographics by Male Poverty

Demographics Similar to Slavs by Male Poverty

In terms of male poverty, the demographic groups most similar to Slavs are Welsh (10.5%, a difference of 0.010%), Canadian (10.5%, a difference of 0.020%), French Canadian (10.5%, a difference of 0.10%), Immigrants from Zimbabwe (10.5%, a difference of 0.11%), and Immigrants from Southern Europe (10.5%, a difference of 0.13%).
DemographicsRating | RankMale Poverty
Immigrants | Egypt
93.7
/100
|
#96
Exceptional
10.4%
Romanians
93.6
/100
|
#97
Exceptional
10.5%
Finns
93.4
/100
|
#98
Exceptional
10.5%
Immigrants | Indonesia
93.3
/100
|
#99
Exceptional
10.5%
Immigrants | Latvia
92.8
/100
|
#100
Exceptional
10.5%
Immigrants | Zimbabwe
92.0
/100
|
#101
Exceptional
10.5%
French Canadians
91.9
/100
|
#102
Exceptional
10.5%
Slavs
91.7
/100
|
#103
Exceptional
10.5%
Welsh
91.6
/100
|
#104
Exceptional
10.5%
Canadians
91.6
/100
|
#105
Exceptional
10.5%
Immigrants | Southern Europe
91.3
/100
|
#106
Exceptional
10.5%
Laotians
91.2
/100
|
#107
Exceptional
10.5%
Portuguese
91.0
/100
|
#108
Exceptional
10.6%
Albanians
90.6
/100
|
#109
Exceptional
10.6%
Argentineans
90.1
/100
|
#110
Exceptional
10.6%

Demographics Similar to Immigrants from Haiti by Male Poverty

In terms of male poverty, the demographic groups most similar to Immigrants from Haiti are Comanche (13.8%, a difference of 0.010%), West Indian (13.8%, a difference of 0.010%), Shoshone (13.8%, a difference of 0.040%), Immigrants from Barbados (13.8%, a difference of 0.060%), and Immigrants from Cabo Verde (13.7%, a difference of 0.21%).
DemographicsRating | RankMale Poverty
Bangladeshis
0.0
/100
|
#277
Tragic
13.6%
Belizeans
0.0
/100
|
#278
Tragic
13.6%
Haitians
0.0
/100
|
#279
Tragic
13.7%
Mexicans
0.0
/100
|
#280
Tragic
13.7%
Yaqui
0.0
/100
|
#281
Tragic
13.7%
Immigrants | Cabo Verde
0.0
/100
|
#282
Tragic
13.7%
Comanche
0.0
/100
|
#283
Tragic
13.8%
Immigrants | Haiti
0.0
/100
|
#284
Tragic
13.8%
West Indians
0.0
/100
|
#285
Tragic
13.8%
Shoshone
0.0
/100
|
#286
Tragic
13.8%
Immigrants | Barbados
0.0
/100
|
#287
Tragic
13.8%
Immigrants | St. Vincent and the Grenadines
0.0
/100
|
#288
Tragic
13.8%
Guatemalans
0.0
/100
|
#289
Tragic
13.8%
Immigrants | Zaire
0.0
/100
|
#290
Tragic
13.8%
Vietnamese
0.0
/100
|
#291
Tragic
13.8%