Taiwanese vs Immigrants from Haiti Male Poverty
COMPARE
Taiwanese
Immigrants from Haiti
Male Poverty
Male Poverty Comparison
Taiwanese
Immigrants from Haiti
11.0%
MALE POVERTY
62.7/ 100
METRIC RATING
159th/ 347
METRIC RANK
13.8%
MALE POVERTY
0.0/ 100
METRIC RATING
284th/ 347
METRIC RANK
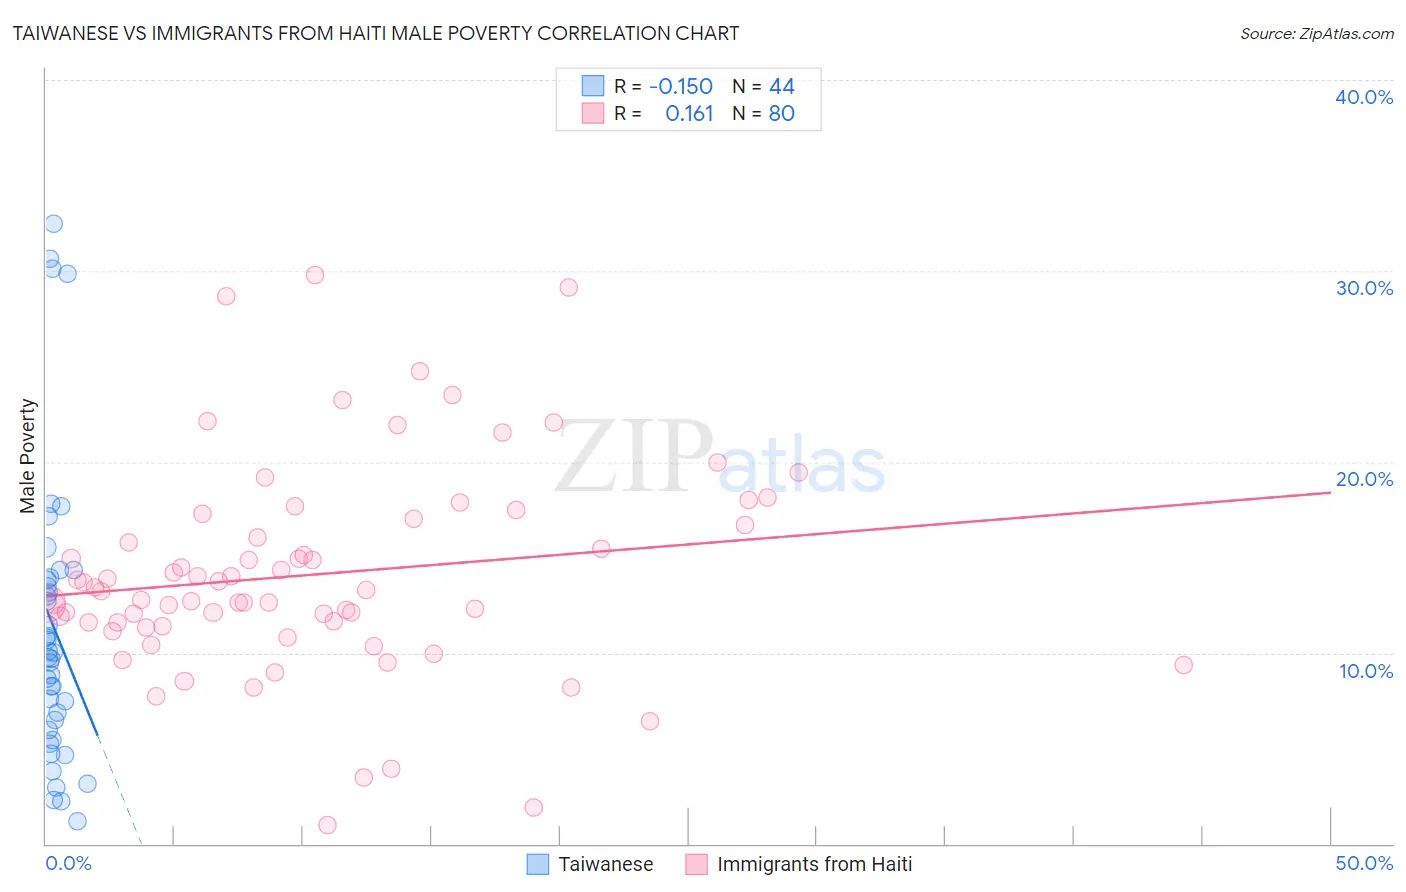
Taiwanese vs Immigrants from Haiti Male Poverty Correlation Chart
The statistical analysis conducted on geographies consisting of 31,715,286 people shows a poor negative correlation between the proportion of Taiwanese and poverty level among males in the United States with a correlation coefficient (R) of -0.150 and weighted average of 11.0%. Similarly, the statistical analysis conducted on geographies consisting of 225,134,025 people shows a poor positive correlation between the proportion of Immigrants from Haiti and poverty level among males in the United States with a correlation coefficient (R) of 0.161 and weighted average of 13.8%, a difference of 24.5%.
Male Poverty Correlation Summary
| Measurement | Taiwanese | Immigrants from Haiti |
| Minimum | 1.2% | 0.99% |
| Maximum | 32.5% | 29.8% |
| Range | 31.3% | 28.8% |
| Mean | 11.3% | 14.1% |
| Median | 9.9% | 13.3% |
| Interquartile 25% (IQ1) | 6.2% | 11.5% |
| Interquartile 75% (IQ3) | 13.9% | 16.9% |
| Interquartile Range (IQR) | 7.6% | 5.4% |
| Standard Deviation (Sample) | 7.6% | 5.5% |
| Standard Deviation (Population) | 7.5% | 5.5% |
Similar Demographics by Male Poverty
Demographics Similar to Taiwanese by Male Poverty
In terms of male poverty, the demographic groups most similar to Taiwanese are Colombian (11.0%, a difference of 0.030%), Scotch-Irish (11.0%, a difference of 0.10%), Costa Rican (11.0%, a difference of 0.12%), Immigrants from Kazakhstan (11.0%, a difference of 0.22%), and Immigrants from Malaysia (11.0%, a difference of 0.22%).
| Demographics | Rating | Rank | Male Poverty |
| Immigrants | Nepal | 67.3 /100 | #152 | Good 11.0% |
| Immigrants | Bosnia and Herzegovina | 65.2 /100 | #153 | Good 11.0% |
| Immigrants | Kazakhstan | 64.8 /100 | #154 | Good 11.0% |
| Immigrants | Malaysia | 64.7 /100 | #155 | Good 11.0% |
| Costa Ricans | 63.9 /100 | #156 | Good 11.0% |
| Scotch-Irish | 63.7 /100 | #157 | Good 11.0% |
| Colombians | 63.0 /100 | #158 | Good 11.0% |
| Taiwanese | 62.7 /100 | #159 | Good 11.0% |
| Soviet Union | 60.3 /100 | #160 | Good 11.1% |
| Immigrants | Northern Africa | 59.7 /100 | #161 | Average 11.1% |
| Immigrants | Chile | 57.4 /100 | #162 | Average 11.1% |
| Whites/Caucasians | 56.7 /100 | #163 | Average 11.1% |
| Ethiopians | 56.7 /100 | #164 | Average 11.1% |
| Immigrants | Spain | 55.5 /100 | #165 | Average 11.1% |
| Immigrants | Albania | 55.3 /100 | #166 | Average 11.1% |
Demographics Similar to Immigrants from Haiti by Male Poverty
In terms of male poverty, the demographic groups most similar to Immigrants from Haiti are Comanche (13.8%, a difference of 0.010%), West Indian (13.8%, a difference of 0.010%), Shoshone (13.8%, a difference of 0.040%), Immigrants from Barbados (13.8%, a difference of 0.060%), and Immigrants from Cabo Verde (13.7%, a difference of 0.21%).
| Demographics | Rating | Rank | Male Poverty |
| Bangladeshis | 0.0 /100 | #277 | Tragic 13.6% |
| Belizeans | 0.0 /100 | #278 | Tragic 13.6% |
| Haitians | 0.0 /100 | #279 | Tragic 13.7% |
| Mexicans | 0.0 /100 | #280 | Tragic 13.7% |
| Yaqui | 0.0 /100 | #281 | Tragic 13.7% |
| Immigrants | Cabo Verde | 0.0 /100 | #282 | Tragic 13.7% |
| Comanche | 0.0 /100 | #283 | Tragic 13.8% |
| Immigrants | Haiti | 0.0 /100 | #284 | Tragic 13.8% |
| West Indians | 0.0 /100 | #285 | Tragic 13.8% |
| Shoshone | 0.0 /100 | #286 | Tragic 13.8% |
| Immigrants | Barbados | 0.0 /100 | #287 | Tragic 13.8% |
| Immigrants | St. Vincent and the Grenadines | 0.0 /100 | #288 | Tragic 13.8% |
| Guatemalans | 0.0 /100 | #289 | Tragic 13.8% |
| Immigrants | Zaire | 0.0 /100 | #290 | Tragic 13.8% |
| Vietnamese | 0.0 /100 | #291 | Tragic 13.8% |