Panamanian vs Immigrants from Haiti Male Poverty
COMPARE
Panamanian
Immigrants from Haiti
Male Poverty
Male Poverty Comparison
Panamanians
Immigrants from Haiti
11.9%
MALE POVERTY
6.2/ 100
METRIC RATING
205th/ 347
METRIC RANK
13.8%
MALE POVERTY
0.0/ 100
METRIC RATING
284th/ 347
METRIC RANK
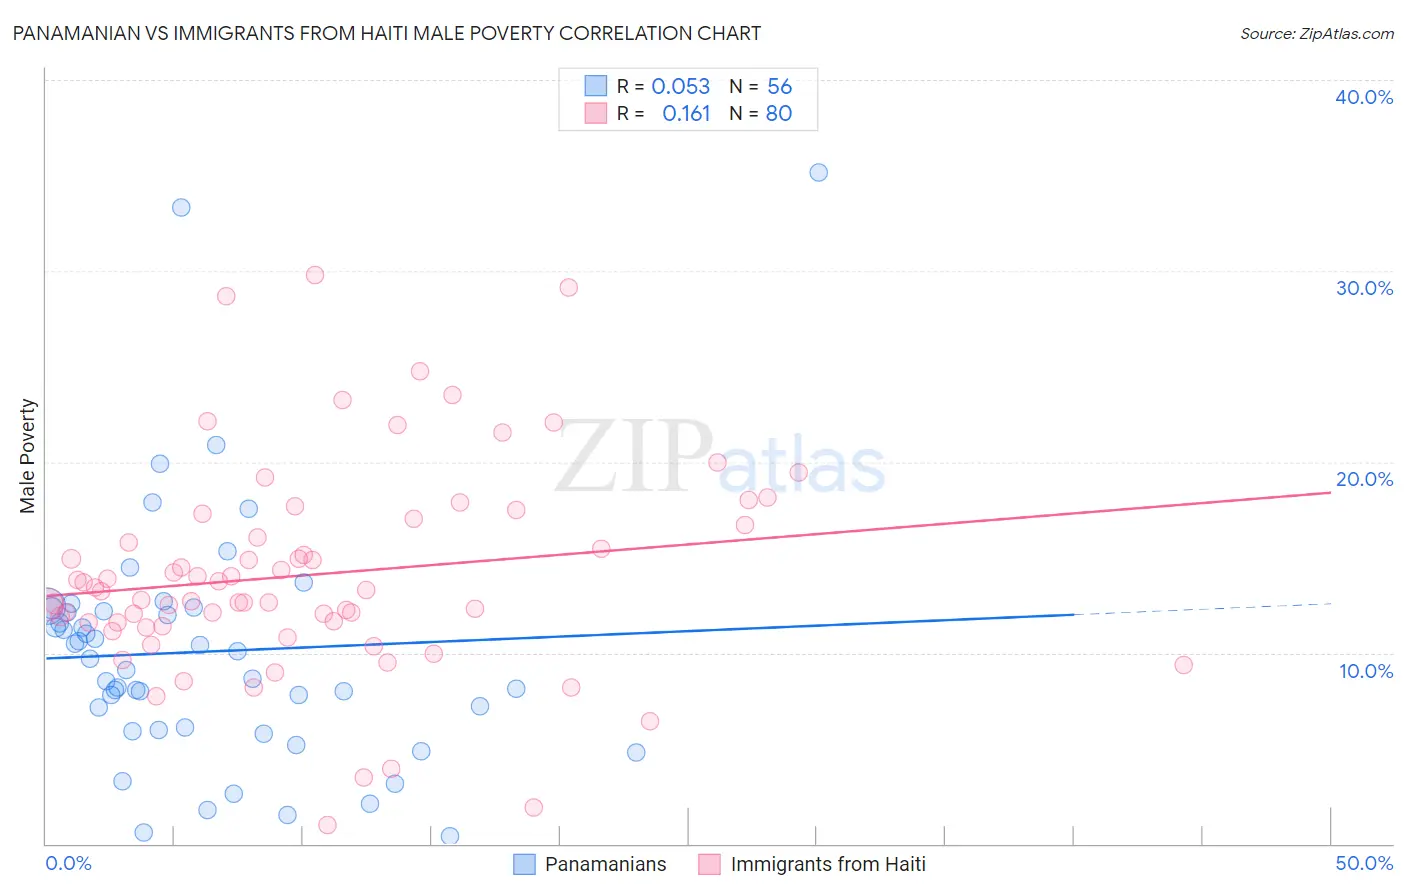
Panamanian vs Immigrants from Haiti Male Poverty Correlation Chart
The statistical analysis conducted on geographies consisting of 281,029,832 people shows a slight positive correlation between the proportion of Panamanians and poverty level among males in the United States with a correlation coefficient (R) of 0.053 and weighted average of 11.9%. Similarly, the statistical analysis conducted on geographies consisting of 225,134,025 people shows a poor positive correlation between the proportion of Immigrants from Haiti and poverty level among males in the United States with a correlation coefficient (R) of 0.161 and weighted average of 13.8%, a difference of 15.3%.
Male Poverty Correlation Summary
| Measurement | Panamanian | Immigrants from Haiti |
| Minimum | 0.40% | 0.99% |
| Maximum | 35.1% | 29.8% |
| Range | 34.7% | 28.8% |
| Mean | 10.1% | 14.1% |
| Median | 9.4% | 13.3% |
| Interquartile 25% (IQ1) | 6.0% | 11.5% |
| Interquartile 75% (IQ3) | 12.2% | 16.9% |
| Interquartile Range (IQR) | 6.2% | 5.4% |
| Standard Deviation (Sample) | 6.5% | 5.5% |
| Standard Deviation (Population) | 6.5% | 5.5% |
Similar Demographics by Male Poverty
Demographics Similar to Panamanians by Male Poverty
In terms of male poverty, the demographic groups most similar to Panamanians are Immigrants from Eastern Africa (12.0%, a difference of 0.35%), Malaysian (12.0%, a difference of 0.45%), Immigrants from Uganda (11.8%, a difference of 0.78%), Immigrants (12.0%, a difference of 0.78%), and Immigrants from the Azores (12.0%, a difference of 0.90%).
| Demographics | Rating | Rank | Male Poverty |
| Iraqis | 14.7 /100 | #198 | Poor 11.7% |
| Spanish | 14.1 /100 | #199 | Poor 11.7% |
| Immigrants | Lebanon | 13.6 /100 | #200 | Poor 11.7% |
| Spaniards | 13.5 /100 | #201 | Poor 11.7% |
| Aleuts | 10.4 /100 | #202 | Poor 11.8% |
| Immigrants | Western Asia | 9.8 /100 | #203 | Tragic 11.8% |
| Immigrants | Uganda | 8.5 /100 | #204 | Tragic 11.8% |
| Panamanians | 6.2 /100 | #205 | Tragic 11.9% |
| Immigrants | Eastern Africa | 5.4 /100 | #206 | Tragic 12.0% |
| Malaysians | 5.2 /100 | #207 | Tragic 12.0% |
| Immigrants | Immigrants | 4.5 /100 | #208 | Tragic 12.0% |
| Immigrants | Azores | 4.3 /100 | #209 | Tragic 12.0% |
| Moroccans | 4.2 /100 | #210 | Tragic 12.0% |
| Immigrants | Panama | 4.0 /100 | #211 | Tragic 12.1% |
| Americans | 3.2 /100 | #212 | Tragic 12.1% |
Demographics Similar to Immigrants from Haiti by Male Poverty
In terms of male poverty, the demographic groups most similar to Immigrants from Haiti are Comanche (13.8%, a difference of 0.010%), West Indian (13.8%, a difference of 0.010%), Shoshone (13.8%, a difference of 0.040%), Immigrants from Barbados (13.8%, a difference of 0.060%), and Immigrants from Cabo Verde (13.7%, a difference of 0.21%).
| Demographics | Rating | Rank | Male Poverty |
| Bangladeshis | 0.0 /100 | #277 | Tragic 13.6% |
| Belizeans | 0.0 /100 | #278 | Tragic 13.6% |
| Haitians | 0.0 /100 | #279 | Tragic 13.7% |
| Mexicans | 0.0 /100 | #280 | Tragic 13.7% |
| Yaqui | 0.0 /100 | #281 | Tragic 13.7% |
| Immigrants | Cabo Verde | 0.0 /100 | #282 | Tragic 13.7% |
| Comanche | 0.0 /100 | #283 | Tragic 13.8% |
| Immigrants | Haiti | 0.0 /100 | #284 | Tragic 13.8% |
| West Indians | 0.0 /100 | #285 | Tragic 13.8% |
| Shoshone | 0.0 /100 | #286 | Tragic 13.8% |
| Immigrants | Barbados | 0.0 /100 | #287 | Tragic 13.8% |
| Immigrants | St. Vincent and the Grenadines | 0.0 /100 | #288 | Tragic 13.8% |
| Guatemalans | 0.0 /100 | #289 | Tragic 13.8% |
| Immigrants | Zaire | 0.0 /100 | #290 | Tragic 13.8% |
| Vietnamese | 0.0 /100 | #291 | Tragic 13.8% |