Immigrants from Eritrea vs Immigrants from Haiti Male Poverty
COMPARE
Immigrants from Eritrea
Immigrants from Haiti
Male Poverty
Male Poverty Comparison
Immigrants from Eritrea
Immigrants from Haiti
12.2%
MALE POVERTY
2.4/ 100
METRIC RATING
220th/ 347
METRIC RANK
13.8%
MALE POVERTY
0.0/ 100
METRIC RATING
284th/ 347
METRIC RANK
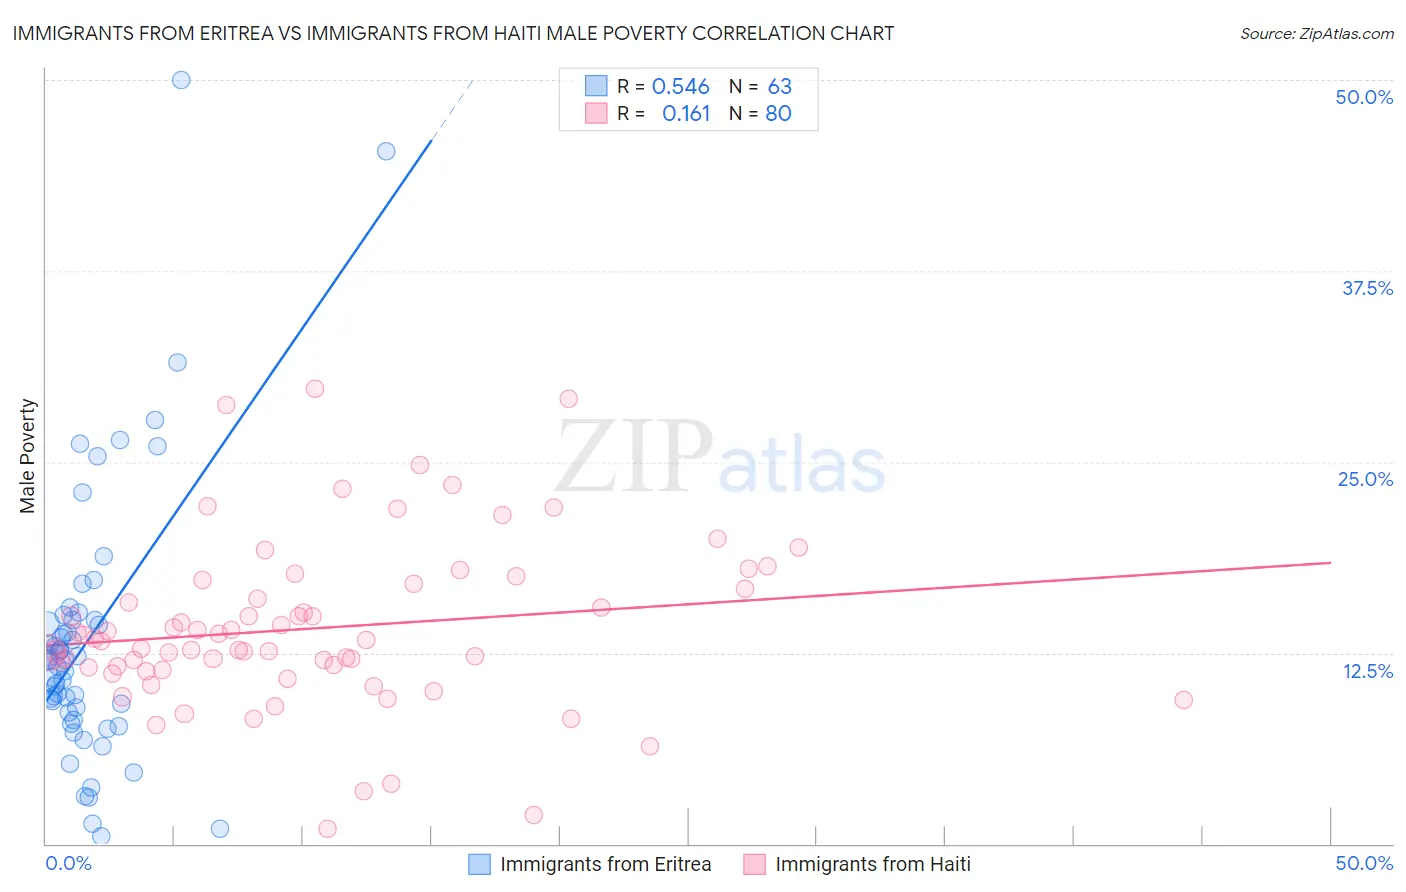
Immigrants from Eritrea vs Immigrants from Haiti Male Poverty Correlation Chart
The statistical analysis conducted on geographies consisting of 104,841,336 people shows a substantial positive correlation between the proportion of Immigrants from Eritrea and poverty level among males in the United States with a correlation coefficient (R) of 0.546 and weighted average of 12.2%. Similarly, the statistical analysis conducted on geographies consisting of 225,134,025 people shows a poor positive correlation between the proportion of Immigrants from Haiti and poverty level among males in the United States with a correlation coefficient (R) of 0.161 and weighted average of 13.8%, a difference of 12.7%.
Male Poverty Correlation Summary
| Measurement | Immigrants from Eritrea | Immigrants from Haiti |
| Minimum | 0.53% | 0.99% |
| Maximum | 50.0% | 29.8% |
| Range | 49.5% | 28.8% |
| Mean | 13.4% | 14.1% |
| Median | 12.0% | 13.3% |
| Interquartile 25% (IQ1) | 8.6% | 11.5% |
| Interquartile 75% (IQ3) | 14.7% | 16.9% |
| Interquartile Range (IQR) | 6.1% | 5.4% |
| Standard Deviation (Sample) | 9.0% | 5.5% |
| Standard Deviation (Population) | 9.0% | 5.5% |
Similar Demographics by Male Poverty
Demographics Similar to Immigrants from Eritrea by Male Poverty
In terms of male poverty, the demographic groups most similar to Immigrants from Eritrea are Bermudan (12.2%, a difference of 0.020%), German Russian (12.2%, a difference of 0.080%), Immigrants from Thailand (12.2%, a difference of 0.11%), Immigrants from Cambodia (12.2%, a difference of 0.12%), and Immigrants from Uzbekistan (12.2%, a difference of 0.20%).
| Demographics | Rating | Rank | Male Poverty |
| Immigrants | Nonimmigrants | 3.1 /100 | #213 | Tragic 12.1% |
| Japanese | 2.7 /100 | #214 | Tragic 12.2% |
| Immigrants | Uzbekistan | 2.6 /100 | #215 | Tragic 12.2% |
| Immigrants | Cambodia | 2.5 /100 | #216 | Tragic 12.2% |
| Immigrants | Thailand | 2.5 /100 | #217 | Tragic 12.2% |
| German Russians | 2.5 /100 | #218 | Tragic 12.2% |
| Bermudans | 2.4 /100 | #219 | Tragic 12.2% |
| Immigrants | Eritrea | 2.4 /100 | #220 | Tragic 12.2% |
| Ugandans | 2.2 /100 | #221 | Tragic 12.2% |
| Immigrants | Africa | 2.1 /100 | #222 | Tragic 12.2% |
| Immigrants | Micronesia | 2.1 /100 | #223 | Tragic 12.2% |
| Immigrants | Nigeria | 1.6 /100 | #224 | Tragic 12.3% |
| Osage | 1.5 /100 | #225 | Tragic 12.3% |
| Nigerians | 1.4 /100 | #226 | Tragic 12.3% |
| Alaska Natives | 1.4 /100 | #227 | Tragic 12.4% |
Demographics Similar to Immigrants from Haiti by Male Poverty
In terms of male poverty, the demographic groups most similar to Immigrants from Haiti are Comanche (13.8%, a difference of 0.010%), West Indian (13.8%, a difference of 0.010%), Shoshone (13.8%, a difference of 0.040%), Immigrants from Barbados (13.8%, a difference of 0.060%), and Immigrants from Cabo Verde (13.7%, a difference of 0.21%).
| Demographics | Rating | Rank | Male Poverty |
| Bangladeshis | 0.0 /100 | #277 | Tragic 13.6% |
| Belizeans | 0.0 /100 | #278 | Tragic 13.6% |
| Haitians | 0.0 /100 | #279 | Tragic 13.7% |
| Mexicans | 0.0 /100 | #280 | Tragic 13.7% |
| Yaqui | 0.0 /100 | #281 | Tragic 13.7% |
| Immigrants | Cabo Verde | 0.0 /100 | #282 | Tragic 13.7% |
| Comanche | 0.0 /100 | #283 | Tragic 13.8% |
| Immigrants | Haiti | 0.0 /100 | #284 | Tragic 13.8% |
| West Indians | 0.0 /100 | #285 | Tragic 13.8% |
| Shoshone | 0.0 /100 | #286 | Tragic 13.8% |
| Immigrants | Barbados | 0.0 /100 | #287 | Tragic 13.8% |
| Immigrants | St. Vincent and the Grenadines | 0.0 /100 | #288 | Tragic 13.8% |
| Guatemalans | 0.0 /100 | #289 | Tragic 13.8% |
| Immigrants | Zaire | 0.0 /100 | #290 | Tragic 13.8% |
| Vietnamese | 0.0 /100 | #291 | Tragic 13.8% |