Sioux vs Nigerian Female Poverty
COMPARE
Sioux
Nigerian
Female Poverty
Female Poverty Comparison
Sioux
Nigerians
20.9%
FEMALE POVERTY
0.0/ 100
METRIC RATING
338th/ 347
METRIC RANK
14.8%
FEMALE POVERTY
1.7/ 100
METRIC RATING
231st/ 347
METRIC RANK
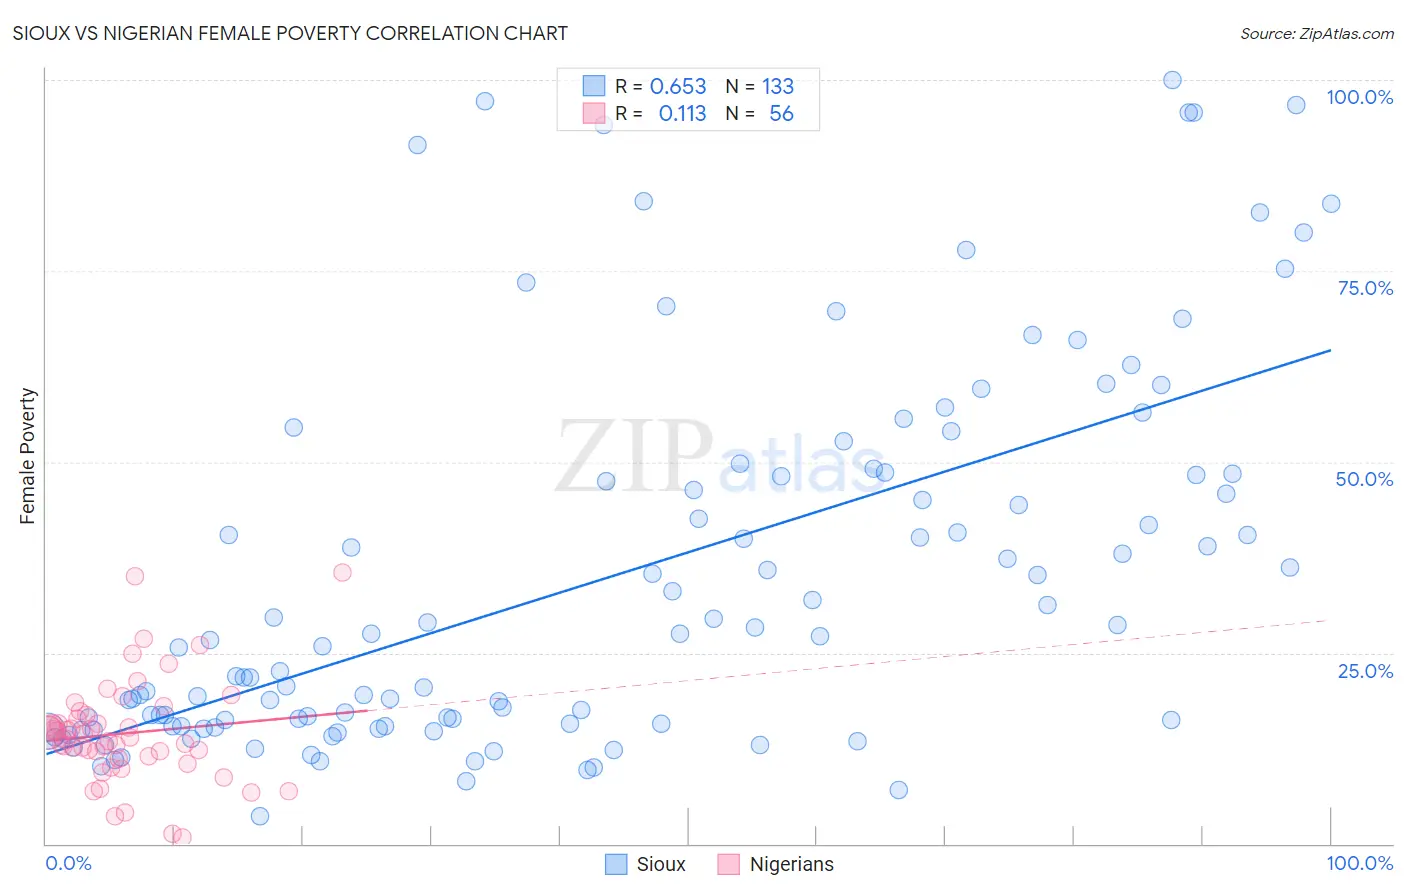
Sioux vs Nigerian Female Poverty Correlation Chart
The statistical analysis conducted on geographies consisting of 234,087,584 people shows a significant positive correlation between the proportion of Sioux and poverty level among females in the United States with a correlation coefficient (R) of 0.653 and weighted average of 20.9%. Similarly, the statistical analysis conducted on geographies consisting of 332,444,319 people shows a poor positive correlation between the proportion of Nigerians and poverty level among females in the United States with a correlation coefficient (R) of 0.113 and weighted average of 14.8%, a difference of 41.5%.
Female Poverty Correlation Summary
| Measurement | Sioux | Nigerian |
| Minimum | 3.5% | 0.81% |
| Maximum | 100.0% | 35.6% |
| Range | 96.5% | 34.7% |
| Mean | 34.8% | 14.4% |
| Median | 26.7% | 13.8% |
| Interquartile 25% (IQ1) | 15.4% | 11.3% |
| Interquartile 75% (IQ3) | 48.4% | 16.6% |
| Interquartile Range (IQR) | 33.0% | 5.3% |
| Standard Deviation (Sample) | 24.5% | 6.8% |
| Standard Deviation (Population) | 24.4% | 6.7% |
Similar Demographics by Female Poverty
Demographics Similar to Sioux by Female Poverty
In terms of female poverty, the demographic groups most similar to Sioux are Yuman (20.8%, a difference of 0.19%), Hopi (21.0%, a difference of 0.37%), Pueblo (20.7%, a difference of 1.0%), Yup'ik (21.5%, a difference of 2.9%), and Cheyenne (20.2%, a difference of 3.4%).
| Demographics | Rating | Rank | Female Poverty |
| Natives/Alaskans | 0.0 /100 | #331 | Tragic 19.2% |
| Apache | 0.0 /100 | #332 | Tragic 19.2% |
| Immigrants | Dominican Republic | 0.0 /100 | #333 | Tragic 19.3% |
| Houma | 0.0 /100 | #334 | Tragic 20.0% |
| Cheyenne | 0.0 /100 | #335 | Tragic 20.2% |
| Pueblo | 0.0 /100 | #336 | Tragic 20.7% |
| Yuman | 0.0 /100 | #337 | Tragic 20.8% |
| Sioux | 0.0 /100 | #338 | Tragic 20.9% |
| Hopi | 0.0 /100 | #339 | Tragic 21.0% |
| Yup'ik | 0.0 /100 | #340 | Tragic 21.5% |
| Crow | 0.0 /100 | #341 | Tragic 22.1% |
| Immigrants | Yemen | 0.0 /100 | #342 | Tragic 22.8% |
| Lumbee | 0.0 /100 | #343 | Tragic 23.5% |
| Pima | 0.0 /100 | #344 | Tragic 23.6% |
| Navajo | 0.0 /100 | #345 | Tragic 23.9% |
Demographics Similar to Nigerians by Female Poverty
In terms of female poverty, the demographic groups most similar to Nigerians are Alaska Native (14.7%, a difference of 0.10%), Ghanaian (14.7%, a difference of 0.30%), Osage (14.8%, a difference of 0.31%), German Russian (14.7%, a difference of 0.36%), and Immigrants from Saudi Arabia (14.8%, a difference of 0.41%).
| Demographics | Rating | Rank | Female Poverty |
| Americans | 2.8 /100 | #224 | Tragic 14.6% |
| Immigrants | Micronesia | 2.8 /100 | #225 | Tragic 14.6% |
| Immigrants | Eritrea | 2.4 /100 | #226 | Tragic 14.6% |
| Immigrants | Nigeria | 2.1 /100 | #227 | Tragic 14.7% |
| German Russians | 2.0 /100 | #228 | Tragic 14.7% |
| Ghanaians | 1.9 /100 | #229 | Tragic 14.7% |
| Alaska Natives | 1.8 /100 | #230 | Tragic 14.7% |
| Nigerians | 1.7 /100 | #231 | Tragic 14.8% |
| Osage | 1.5 /100 | #232 | Tragic 14.8% |
| Immigrants | Saudi Arabia | 1.4 /100 | #233 | Tragic 14.8% |
| Fijians | 1.1 /100 | #234 | Tragic 14.9% |
| Immigrants | Laos | 0.9 /100 | #235 | Tragic 15.0% |
| Cree | 0.7 /100 | #236 | Tragic 15.1% |
| French American Indians | 0.6 /100 | #237 | Tragic 15.1% |
| Immigrants | Armenia | 0.6 /100 | #238 | Tragic 15.1% |