Sioux vs Nigerian In Labor Force | Age 25-29
COMPARE
Sioux
Nigerian
In Labor Force | Age 25-29
In Labor Force | Age 25-29 Comparison
Sioux
Nigerians
79.7%
IN LABOR FORCE | AGE 25-29
0.0/ 100
METRIC RATING
333rd/ 347
METRIC RANK
84.3%
IN LABOR FORCE | AGE 25-29
7.2/ 100
METRIC RATING
220th/ 347
METRIC RANK
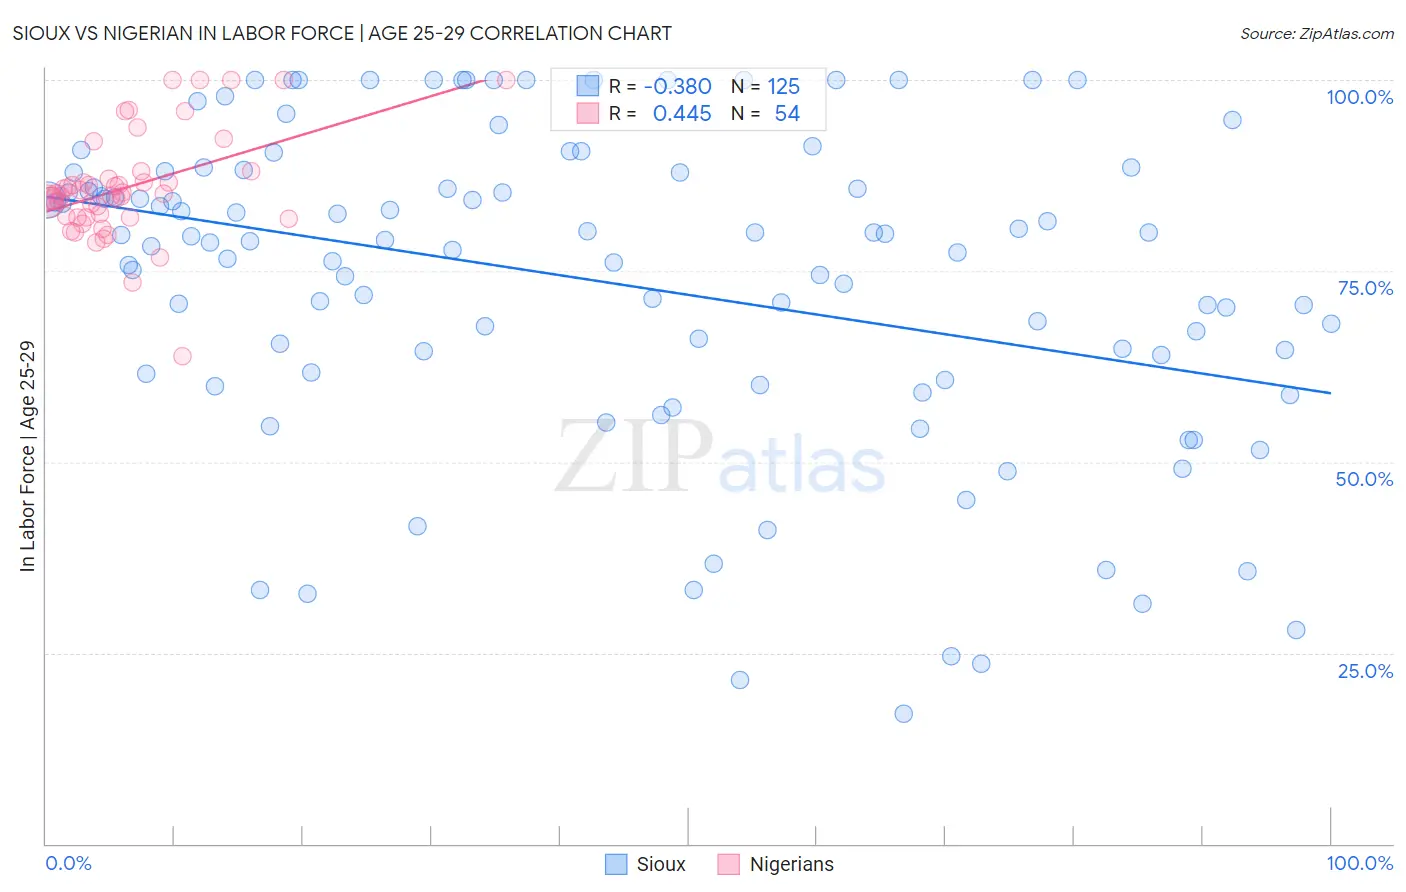
Sioux vs Nigerian In Labor Force | Age 25-29 Correlation Chart
The statistical analysis conducted on geographies consisting of 234,111,453 people shows a mild negative correlation between the proportion of Sioux and labor force participation rate among population between the ages 25 and 29 in the United States with a correlation coefficient (R) of -0.380 and weighted average of 79.7%. Similarly, the statistical analysis conducted on geographies consisting of 332,698,985 people shows a moderate positive correlation between the proportion of Nigerians and labor force participation rate among population between the ages 25 and 29 in the United States with a correlation coefficient (R) of 0.445 and weighted average of 84.3%, a difference of 5.8%.
In Labor Force | Age 25-29 Correlation Summary
| Measurement | Sioux | Nigerian |
| Minimum | 17.0% | 63.9% |
| Maximum | 100.0% | 100.0% |
| Range | 83.0% | 36.1% |
| Mean | 73.7% | 85.9% |
| Median | 78.9% | 85.0% |
| Interquartile 25% (IQ1) | 61.6% | 82.0% |
| Interquartile 75% (IQ3) | 87.9% | 87.1% |
| Interquartile Range (IQR) | 26.3% | 5.1% |
| Standard Deviation (Sample) | 20.5% | 6.9% |
| Standard Deviation (Population) | 20.4% | 6.9% |
Similar Demographics by In Labor Force | Age 25-29
Demographics Similar to Sioux by In Labor Force | Age 25-29
In terms of in labor force | age 25-29, the demographic groups most similar to Sioux are Inupiat (79.8%, a difference of 0.11%), Yuman (79.3%, a difference of 0.42%), Native/Alaskan (79.3%, a difference of 0.50%), Apache (79.2%, a difference of 0.57%), and Cheyenne (80.3%, a difference of 0.80%).
| Demographics | Rating | Rank | In Labor Force | Age 25-29 |
| Choctaw | 0.0 /100 | #326 | Tragic 81.0% |
| Ute | 0.0 /100 | #327 | Tragic 80.8% |
| Creek | 0.0 /100 | #328 | Tragic 80.7% |
| Yakama | 0.0 /100 | #329 | Tragic 80.6% |
| Puerto Ricans | 0.0 /100 | #330 | Tragic 80.4% |
| Cheyenne | 0.0 /100 | #331 | Tragic 80.3% |
| Inupiat | 0.0 /100 | #332 | Tragic 79.8% |
| Sioux | 0.0 /100 | #333 | Tragic 79.7% |
| Yuman | 0.0 /100 | #334 | Tragic 79.3% |
| Natives/Alaskans | 0.0 /100 | #335 | Tragic 79.3% |
| Apache | 0.0 /100 | #336 | Tragic 79.2% |
| Crow | 0.0 /100 | #337 | Tragic 78.6% |
| Lumbee | 0.0 /100 | #338 | Tragic 78.3% |
| Immigrants | Yemen | 0.0 /100 | #339 | Tragic 78.2% |
| Paiute | 0.0 /100 | #340 | Tragic 78.1% |
Demographics Similar to Nigerians by In Labor Force | Age 25-29
In terms of in labor force | age 25-29, the demographic groups most similar to Nigerians are Arab (84.2%, a difference of 0.010%), Jordanian (84.2%, a difference of 0.010%), Scotch-Irish (84.2%, a difference of 0.020%), Immigrants from Nigeria (84.3%, a difference of 0.040%), and Immigrants from Saudi Arabia (84.3%, a difference of 0.040%).
| Demographics | Rating | Rank | In Labor Force | Age 25-29 |
| Japanese | 11.4 /100 | #213 | Poor 84.3% |
| Lebanese | 11.1 /100 | #214 | Poor 84.3% |
| Immigrants | Syria | 10.7 /100 | #215 | Poor 84.3% |
| Israelis | 9.3 /100 | #216 | Tragic 84.3% |
| Immigrants | Ecuador | 9.3 /100 | #217 | Tragic 84.3% |
| Immigrants | Nigeria | 9.0 /100 | #218 | Tragic 84.3% |
| Immigrants | Saudi Arabia | 8.8 /100 | #219 | Tragic 84.3% |
| Nigerians | 7.2 /100 | #220 | Tragic 84.3% |
| Arabs | 6.8 /100 | #221 | Tragic 84.2% |
| Jordanians | 6.7 /100 | #222 | Tragic 84.2% |
| Scotch-Irish | 6.5 /100 | #223 | Tragic 84.2% |
| Immigrants | West Indies | 6.0 /100 | #224 | Tragic 84.2% |
| Koreans | 5.9 /100 | #225 | Tragic 84.2% |
| Immigrants | Congo | 5.8 /100 | #226 | Tragic 84.2% |
| French American Indians | 5.5 /100 | #227 | Tragic 84.2% |