Kenyan vs Nigerian Female Poverty
COMPARE
Kenyan
Nigerian
Female Poverty
Female Poverty Comparison
Kenyans
Nigerians
13.5%
FEMALE POVERTY
43.8/ 100
METRIC RATING
183rd/ 347
METRIC RANK
14.8%
FEMALE POVERTY
1.7/ 100
METRIC RATING
231st/ 347
METRIC RANK
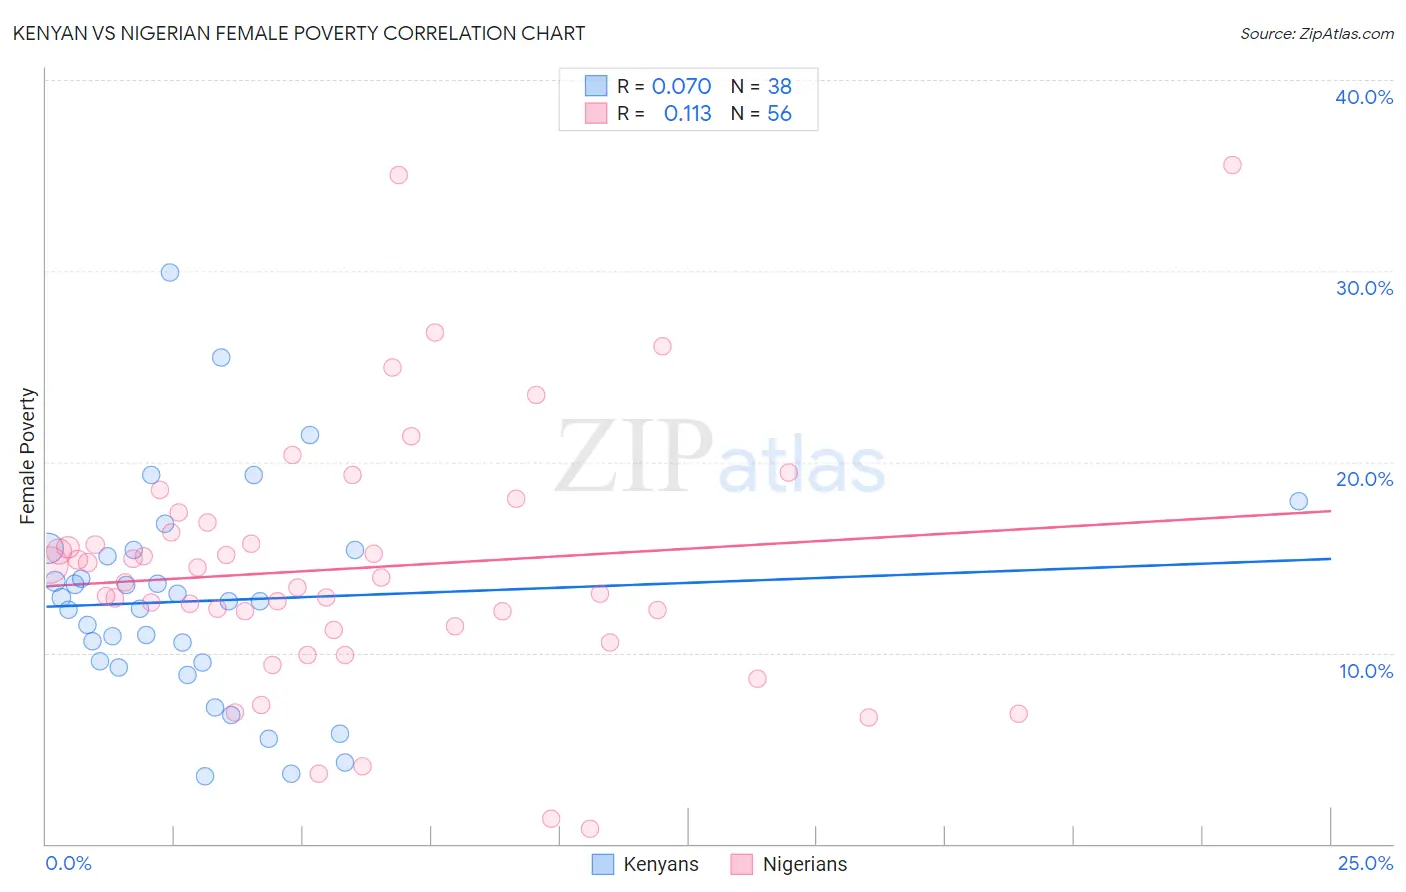
Kenyan vs Nigerian Female Poverty Correlation Chart
The statistical analysis conducted on geographies consisting of 168,133,672 people shows a slight positive correlation between the proportion of Kenyans and poverty level among females in the United States with a correlation coefficient (R) of 0.070 and weighted average of 13.5%. Similarly, the statistical analysis conducted on geographies consisting of 332,444,319 people shows a poor positive correlation between the proportion of Nigerians and poverty level among females in the United States with a correlation coefficient (R) of 0.113 and weighted average of 14.8%, a difference of 9.1%.
Female Poverty Correlation Summary
| Measurement | Kenyan | Nigerian |
| Minimum | 3.5% | 0.81% |
| Maximum | 29.9% | 35.6% |
| Range | 26.4% | 34.7% |
| Mean | 12.7% | 14.4% |
| Median | 12.7% | 13.8% |
| Interquartile 25% (IQ1) | 9.5% | 11.3% |
| Interquartile 75% (IQ3) | 15.4% | 16.6% |
| Interquartile Range (IQR) | 5.9% | 5.3% |
| Standard Deviation (Sample) | 5.6% | 6.8% |
| Standard Deviation (Population) | 5.5% | 6.7% |
Similar Demographics by Female Poverty
Demographics Similar to Kenyans by Female Poverty
In terms of female poverty, the demographic groups most similar to Kenyans are Immigrants from Sierra Leone (13.5%, a difference of 0.060%), Venezuelan (13.5%, a difference of 0.070%), Immigrants from Colombia (13.5%, a difference of 0.070%), South American (13.5%, a difference of 0.10%), and Immigrants from Cameroon (13.5%, a difference of 0.17%).
| Demographics | Rating | Rank | Female Poverty |
| Immigrants | Spain | 49.9 /100 | #176 | Average 13.4% |
| Immigrants | Morocco | 49.4 /100 | #177 | Average 13.4% |
| Israelis | 49.1 /100 | #178 | Average 13.5% |
| Immigrants | Syria | 48.8 /100 | #179 | Average 13.5% |
| South Americans | 44.8 /100 | #180 | Average 13.5% |
| Venezuelans | 44.5 /100 | #181 | Average 13.5% |
| Immigrants | Colombia | 44.5 /100 | #182 | Average 13.5% |
| Kenyans | 43.8 /100 | #183 | Average 13.5% |
| Immigrants | Sierra Leone | 43.2 /100 | #184 | Average 13.5% |
| Immigrants | Cameroon | 42.0 /100 | #185 | Average 13.5% |
| Immigrants | Portugal | 41.5 /100 | #186 | Average 13.6% |
| Immigrants | Venezuela | 41.0 /100 | #187 | Average 13.6% |
| Hawaiians | 39.9 /100 | #188 | Fair 13.6% |
| Uruguayans | 39.8 /100 | #189 | Fair 13.6% |
| Sierra Leoneans | 33.1 /100 | #190 | Fair 13.7% |
Demographics Similar to Nigerians by Female Poverty
In terms of female poverty, the demographic groups most similar to Nigerians are Alaska Native (14.7%, a difference of 0.10%), Ghanaian (14.7%, a difference of 0.30%), Osage (14.8%, a difference of 0.31%), German Russian (14.7%, a difference of 0.36%), and Immigrants from Saudi Arabia (14.8%, a difference of 0.41%).
| Demographics | Rating | Rank | Female Poverty |
| Americans | 2.8 /100 | #224 | Tragic 14.6% |
| Immigrants | Micronesia | 2.8 /100 | #225 | Tragic 14.6% |
| Immigrants | Eritrea | 2.4 /100 | #226 | Tragic 14.6% |
| Immigrants | Nigeria | 2.1 /100 | #227 | Tragic 14.7% |
| German Russians | 2.0 /100 | #228 | Tragic 14.7% |
| Ghanaians | 1.9 /100 | #229 | Tragic 14.7% |
| Alaska Natives | 1.8 /100 | #230 | Tragic 14.7% |
| Nigerians | 1.7 /100 | #231 | Tragic 14.8% |
| Osage | 1.5 /100 | #232 | Tragic 14.8% |
| Immigrants | Saudi Arabia | 1.4 /100 | #233 | Tragic 14.8% |
| Fijians | 1.1 /100 | #234 | Tragic 14.9% |
| Immigrants | Laos | 0.9 /100 | #235 | Tragic 15.0% |
| Cree | 0.7 /100 | #236 | Tragic 15.1% |
| French American Indians | 0.6 /100 | #237 | Tragic 15.1% |
| Immigrants | Armenia | 0.6 /100 | #238 | Tragic 15.1% |