Choctaw vs Latvian Single Mother Poverty
COMPARE
Choctaw
Latvian
Single Mother Poverty
Single Mother Poverty Comparison
Choctaw
Latvians
36.4%
SINGLE MOTHER POVERTY
0.0/ 100
METRIC RATING
328th/ 347
METRIC RANK
26.9%
SINGLE MOTHER POVERTY
99.9/ 100
METRIC RATING
45th/ 347
METRIC RANK
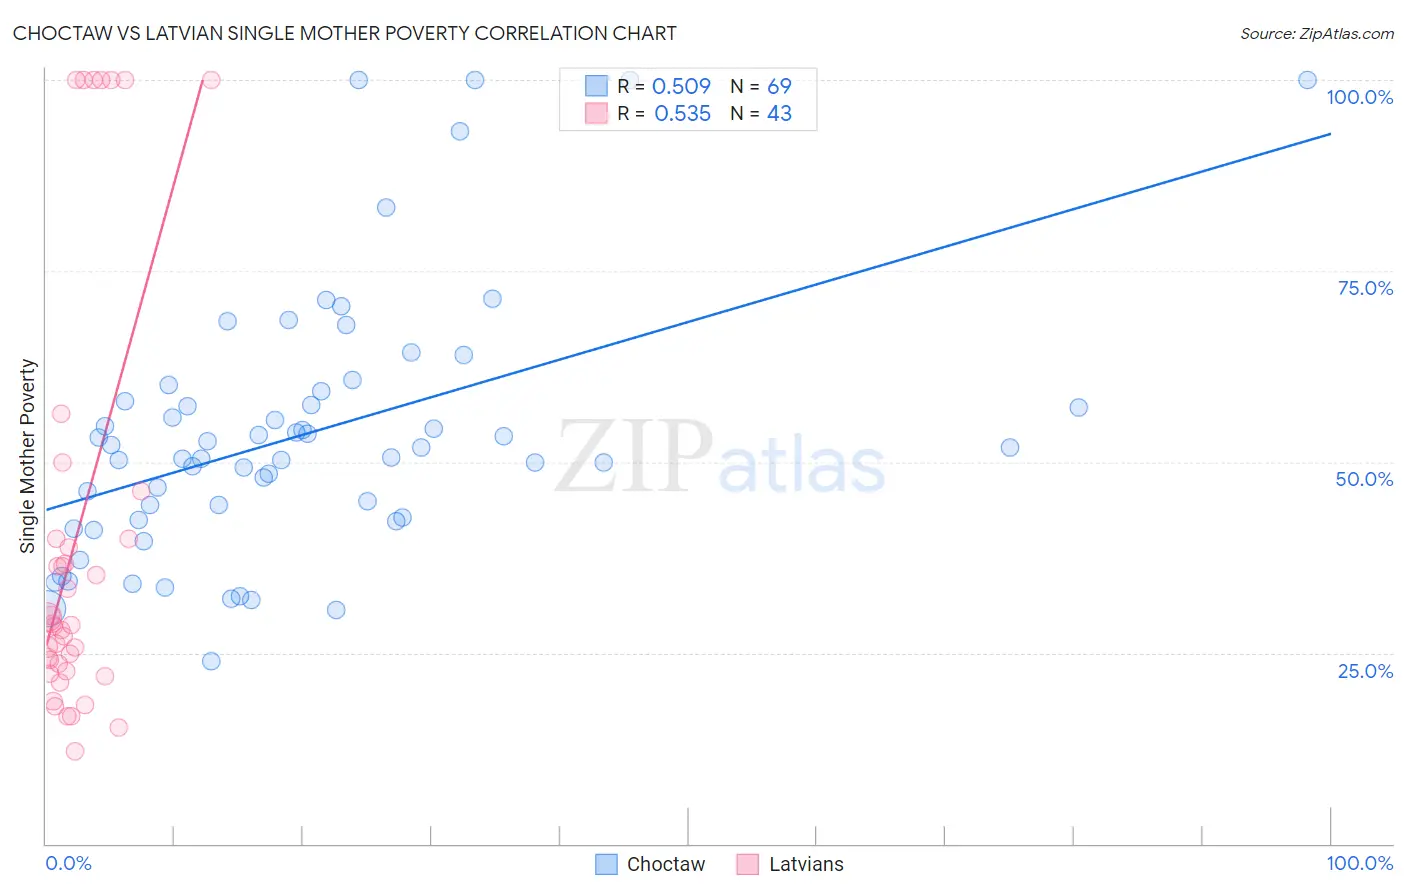
Choctaw vs Latvian Single Mother Poverty Correlation Chart
The statistical analysis conducted on geographies consisting of 266,090,747 people shows a substantial positive correlation between the proportion of Choctaw and poverty level among single mothers in the United States with a correlation coefficient (R) of 0.509 and weighted average of 36.4%. Similarly, the statistical analysis conducted on geographies consisting of 216,142,083 people shows a substantial positive correlation between the proportion of Latvians and poverty level among single mothers in the United States with a correlation coefficient (R) of 0.535 and weighted average of 26.9%, a difference of 35.5%.
Single Mother Poverty Correlation Summary
| Measurement | Choctaw | Latvian |
| Minimum | 24.0% | 12.0% |
| Maximum | 100.0% | 100.0% |
| Range | 76.0% | 88.0% |
| Mean | 53.6% | 40.2% |
| Median | 51.8% | 28.6% |
| Interquartile 25% (IQ1) | 42.5% | 22.6% |
| Interquartile 75% (IQ3) | 58.6% | 40.0% |
| Interquartile Range (IQR) | 16.1% | 17.4% |
| Standard Deviation (Sample) | 17.1% | 28.2% |
| Standard Deviation (Population) | 17.0% | 27.9% |
Similar Demographics by Single Mother Poverty
Demographics Similar to Choctaw by Single Mother Poverty
In terms of single mother poverty, the demographic groups most similar to Choctaw are Yakama (36.4%, a difference of 0.060%), Apache (36.6%, a difference of 0.48%), Native/Alaskan (36.6%, a difference of 0.58%), Creek (36.7%, a difference of 0.74%), and Dutch West Indian (36.8%, a difference of 0.98%).
| Demographics | Rating | Rank | Single Mother Poverty |
| Paiute | 0.0 /100 | #321 | Tragic 35.1% |
| Blacks/African Americans | 0.0 /100 | #322 | Tragic 35.2% |
| Kiowa | 0.0 /100 | #323 | Tragic 35.5% |
| Ottawa | 0.0 /100 | #324 | Tragic 35.5% |
| Ute | 0.0 /100 | #325 | Tragic 35.7% |
| Seminole | 0.0 /100 | #326 | Tragic 35.8% |
| Yakama | 0.0 /100 | #327 | Tragic 36.4% |
| Choctaw | 0.0 /100 | #328 | Tragic 36.4% |
| Apache | 0.0 /100 | #329 | Tragic 36.6% |
| Natives/Alaskans | 0.0 /100 | #330 | Tragic 36.6% |
| Creek | 0.0 /100 | #331 | Tragic 36.7% |
| Dutch West Indians | 0.0 /100 | #332 | Tragic 36.8% |
| Menominee | 0.0 /100 | #333 | Tragic 37.1% |
| Pueblo | 0.0 /100 | #334 | Tragic 37.2% |
| Yuman | 0.0 /100 | #335 | Tragic 37.8% |
Demographics Similar to Latvians by Single Mother Poverty
In terms of single mother poverty, the demographic groups most similar to Latvians are Immigrants from Serbia (26.9%, a difference of 0.040%), Immigrants from Sierra Leone (26.9%, a difference of 0.070%), Egyptian (26.9%, a difference of 0.10%), Immigrants from Poland (26.9%, a difference of 0.18%), and Tsimshian (26.8%, a difference of 0.21%).
| Demographics | Rating | Rank | Single Mother Poverty |
| Immigrants | Fiji | 99.9 /100 | #38 | Exceptional 26.6% |
| Sri Lankans | 99.9 /100 | #39 | Exceptional 26.7% |
| Immigrants | Vietnam | 99.9 /100 | #40 | Exceptional 26.7% |
| Immigrants | Greece | 99.9 /100 | #41 | Exceptional 26.7% |
| Armenians | 99.9 /100 | #42 | Exceptional 26.8% |
| Tsimshian | 99.9 /100 | #43 | Exceptional 26.8% |
| Immigrants | Sierra Leone | 99.9 /100 | #44 | Exceptional 26.9% |
| Latvians | 99.9 /100 | #45 | Exceptional 26.9% |
| Immigrants | Serbia | 99.9 /100 | #46 | Exceptional 26.9% |
| Egyptians | 99.8 /100 | #47 | Exceptional 26.9% |
| Immigrants | Poland | 99.8 /100 | #48 | Exceptional 26.9% |
| Cambodians | 99.8 /100 | #49 | Exceptional 27.0% |
| Laotians | 99.8 /100 | #50 | Exceptional 27.0% |
| Immigrants | Argentina | 99.7 /100 | #51 | Exceptional 27.1% |
| Immigrants | South Eastern Asia | 99.7 /100 | #52 | Exceptional 27.1% |