Sioux vs Latvian Receiving Food Stamps
COMPARE
Sioux
Latvian
Receiving Food Stamps
Receiving Food Stamps Comparison
Sioux
Latvians
16.8%
RECEIVING FOOD STAMPS
0.0/ 100
METRIC RATING
312th/ 347
METRIC RANK
9.1%
RECEIVING FOOD STAMPS
99.8/ 100
METRIC RATING
20th/ 347
METRIC RANK
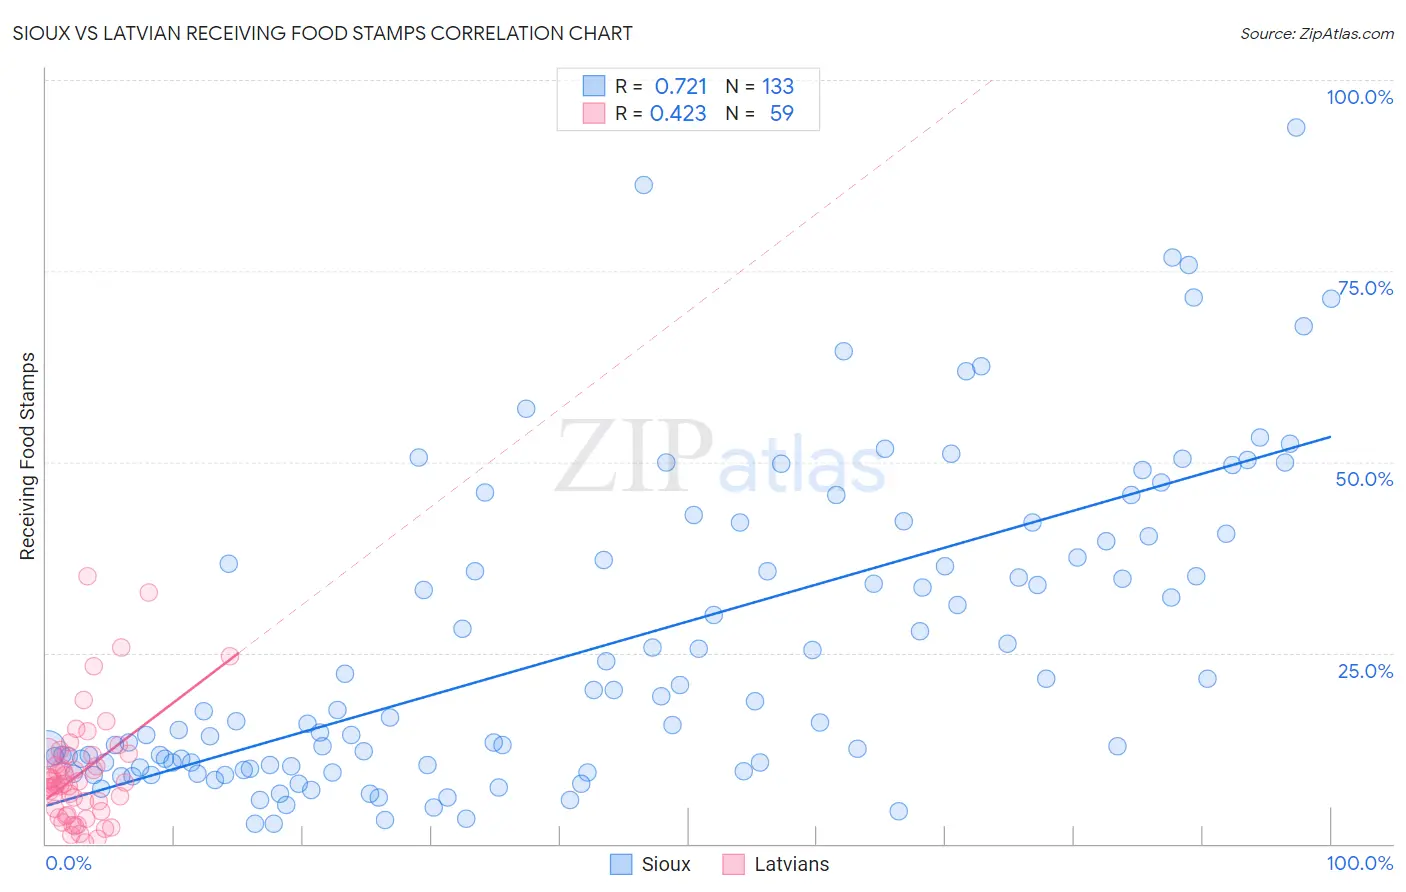
Sioux vs Latvian Receiving Food Stamps Correlation Chart
The statistical analysis conducted on geographies consisting of 234,002,578 people shows a strong positive correlation between the proportion of Sioux and percentage of population receiving government assistance and/or food stamps in the United States with a correlation coefficient (R) of 0.721 and weighted average of 16.8%. Similarly, the statistical analysis conducted on geographies consisting of 220,272,537 people shows a moderate positive correlation between the proportion of Latvians and percentage of population receiving government assistance and/or food stamps in the United States with a correlation coefficient (R) of 0.423 and weighted average of 9.1%, a difference of 84.5%.
Receiving Food Stamps Correlation Summary
| Measurement | Sioux | Latvian |
| Minimum | 2.6% | 0.20% |
| Maximum | 93.8% | 35.1% |
| Range | 91.2% | 34.9% |
| Mean | 26.1% | 9.3% |
| Median | 17.3% | 7.9% |
| Interquartile 25% (IQ1) | 10.3% | 4.2% |
| Interquartile 75% (IQ3) | 39.9% | 11.7% |
| Interquartile Range (IQR) | 29.7% | 7.5% |
| Standard Deviation (Sample) | 20.2% | 7.2% |
| Standard Deviation (Population) | 20.2% | 7.2% |
Similar Demographics by Receiving Food Stamps
Demographics Similar to Sioux by Receiving Food Stamps
In terms of receiving food stamps, the demographic groups most similar to Sioux are Immigrants from Jamaica (16.9%, a difference of 0.28%), Immigrants from Guyana (16.9%, a difference of 0.45%), Guyanese (16.7%, a difference of 0.70%), Bahamian (17.0%, a difference of 1.0%), and Immigrants from Barbados (16.6%, a difference of 1.2%).
| Demographics | Rating | Rank | Receiving Food Stamps |
| Immigrants | Azores | 0.0 /100 | #305 | Tragic 16.4% |
| Jamaicans | 0.0 /100 | #306 | Tragic 16.4% |
| Houma | 0.0 /100 | #307 | Tragic 16.5% |
| Barbadians | 0.0 /100 | #308 | Tragic 16.5% |
| U.S. Virgin Islanders | 0.0 /100 | #309 | Tragic 16.5% |
| Immigrants | Barbados | 0.0 /100 | #310 | Tragic 16.6% |
| Guyanese | 0.0 /100 | #311 | Tragic 16.7% |
| Sioux | 0.0 /100 | #312 | Tragic 16.8% |
| Immigrants | Jamaica | 0.0 /100 | #313 | Tragic 16.9% |
| Immigrants | Guyana | 0.0 /100 | #314 | Tragic 16.9% |
| Bahamians | 0.0 /100 | #315 | Tragic 17.0% |
| Central American Indians | 0.0 /100 | #316 | Tragic 17.1% |
| Blacks/African Americans | 0.0 /100 | #317 | Tragic 17.2% |
| Menominee | 0.0 /100 | #318 | Tragic 17.2% |
| Immigrants | St. Vincent and the Grenadines | 0.0 /100 | #319 | Tragic 17.2% |
Demographics Similar to Latvians by Receiving Food Stamps
In terms of receiving food stamps, the demographic groups most similar to Latvians are Luxembourger (9.1%, a difference of 0.15%), Immigrants from Hong Kong (9.1%, a difference of 0.33%), Immigrants from Australia (9.2%, a difference of 0.40%), Eastern European (9.2%, a difference of 0.51%), and Immigrants from Northern Europe (9.2%, a difference of 0.54%).
| Demographics | Rating | Rank | Receiving Food Stamps |
| Bulgarians | 99.9 /100 | #13 | Exceptional 8.9% |
| Maltese | 99.9 /100 | #14 | Exceptional 8.9% |
| Norwegians | 99.9 /100 | #15 | Exceptional 9.0% |
| Immigrants | Japan | 99.9 /100 | #16 | Exceptional 9.0% |
| Immigrants | Scotland | 99.9 /100 | #17 | Exceptional 9.0% |
| Danes | 99.9 /100 | #18 | Exceptional 9.0% |
| Immigrants | Hong Kong | 99.8 /100 | #19 | Exceptional 9.1% |
| Latvians | 99.8 /100 | #20 | Exceptional 9.1% |
| Luxembourgers | 99.8 /100 | #21 | Exceptional 9.1% |
| Immigrants | Australia | 99.8 /100 | #22 | Exceptional 9.2% |
| Eastern Europeans | 99.8 /100 | #23 | Exceptional 9.2% |
| Immigrants | Northern Europe | 99.8 /100 | #24 | Exceptional 9.2% |
| Immigrants | Ireland | 99.8 /100 | #25 | Exceptional 9.2% |
| Swedes | 99.8 /100 | #26 | Exceptional 9.2% |
| Bhutanese | 99.8 /100 | #27 | Exceptional 9.2% |