Sioux vs Immigrants from Congo Poverty
COMPARE
Sioux
Immigrants from Congo
Poverty
Poverty Comparison
Sioux
Immigrants from Congo
19.8%
POVERTY
0.0/ 100
METRIC RATING
337th/ 347
METRIC RANK
16.1%
POVERTY
0.0/ 100
METRIC RATING
319th/ 347
METRIC RANK
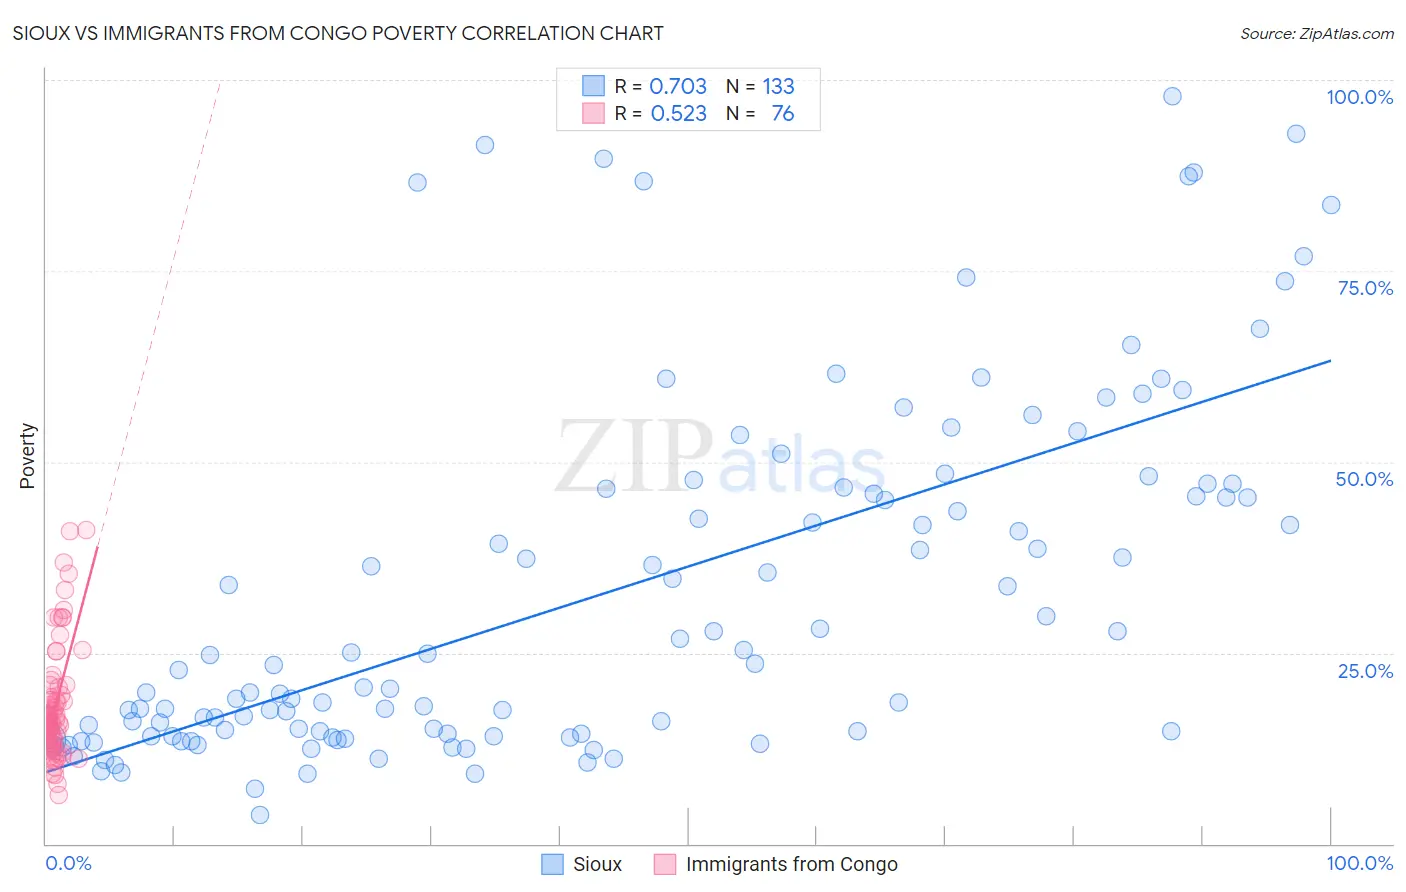
Sioux vs Immigrants from Congo Poverty Correlation Chart
The statistical analysis conducted on geographies consisting of 234,110,660 people shows a strong positive correlation between the proportion of Sioux and poverty level in the United States with a correlation coefficient (R) of 0.703 and weighted average of 19.8%. Similarly, the statistical analysis conducted on geographies consisting of 92,094,185 people shows a substantial positive correlation between the proportion of Immigrants from Congo and poverty level in the United States with a correlation coefficient (R) of 0.523 and weighted average of 16.1%, a difference of 22.6%.
Poverty Correlation Summary
| Measurement | Sioux | Immigrants from Congo |
| Minimum | 3.8% | 6.3% |
| Maximum | 97.9% | 41.0% |
| Range | 94.1% | 34.7% |
| Mean | 32.9% | 18.1% |
| Median | 23.5% | 16.1% |
| Interquartile 25% (IQ1) | 14.2% | 13.3% |
| Interquartile 75% (IQ3) | 46.5% | 20.0% |
| Interquartile Range (IQR) | 32.3% | 6.7% |
| Standard Deviation (Sample) | 23.2% | 7.4% |
| Standard Deviation (Population) | 23.1% | 7.4% |
Demographics Similar to Sioux and Immigrants from Congo by Poverty
In terms of poverty, the demographic groups most similar to Sioux are Pueblo (19.4%, a difference of 1.9%), Yuman (20.2%, a difference of 2.2%), Cheyenne (18.9%, a difference of 4.4%), Houma (18.4%, a difference of 7.3%), and Apache (18.4%, a difference of 7.3%). Similarly, the demographic groups most similar to Immigrants from Congo are Immigrants from Dominica (16.1%, a difference of 0.20%), Immigrants from Honduras (16.2%, a difference of 0.23%), Arapaho (16.3%, a difference of 0.97%), Menominee (16.4%, a difference of 1.9%), and Colville (16.6%, a difference of 2.7%).
| Demographics | Rating | Rank | Poverty |
| Immigrants | Dominica | 0.0 /100 | #318 | Tragic 16.1% |
| Immigrants | Congo | 0.0 /100 | #319 | Tragic 16.1% |
| Immigrants | Honduras | 0.0 /100 | #320 | Tragic 16.2% |
| Arapaho | 0.0 /100 | #321 | Tragic 16.3% |
| Menominee | 0.0 /100 | #322 | Tragic 16.4% |
| Colville | 0.0 /100 | #323 | Tragic 16.6% |
| Yakama | 0.0 /100 | #324 | Tragic 16.7% |
| Central American Indians | 0.0 /100 | #325 | Tragic 16.7% |
| Paiute | 0.0 /100 | #326 | Tragic 16.7% |
| Kiowa | 0.0 /100 | #327 | Tragic 16.8% |
| Ute | 0.0 /100 | #328 | Tragic 16.9% |
| Blacks/African Americans | 0.0 /100 | #329 | Tragic 17.3% |
| Dominicans | 0.0 /100 | #330 | Tragic 17.6% |
| Immigrants | Dominican Republic | 0.0 /100 | #331 | Tragic 17.8% |
| Natives/Alaskans | 0.0 /100 | #332 | Tragic 18.1% |
| Houma | 0.0 /100 | #333 | Tragic 18.4% |
| Apache | 0.0 /100 | #334 | Tragic 18.4% |
| Cheyenne | 0.0 /100 | #335 | Tragic 18.9% |
| Pueblo | 0.0 /100 | #336 | Tragic 19.4% |
| Sioux | 0.0 /100 | #337 | Tragic 19.8% |
| Yuman | 0.0 /100 | #338 | Tragic 20.2% |