Thai vs Immigrants from Iran Single Male Poverty
COMPARE
Thai
Immigrants from Iran
Single Male Poverty
Single Male Poverty Comparison
Thais
Immigrants from Iran
10.8%
SINGLE MALE POVERTY
100.0/ 100
METRIC RATING
8th/ 347
METRIC RANK
11.4%
SINGLE MALE POVERTY
100.0/ 100
METRIC RATING
31st/ 347
METRIC RANK
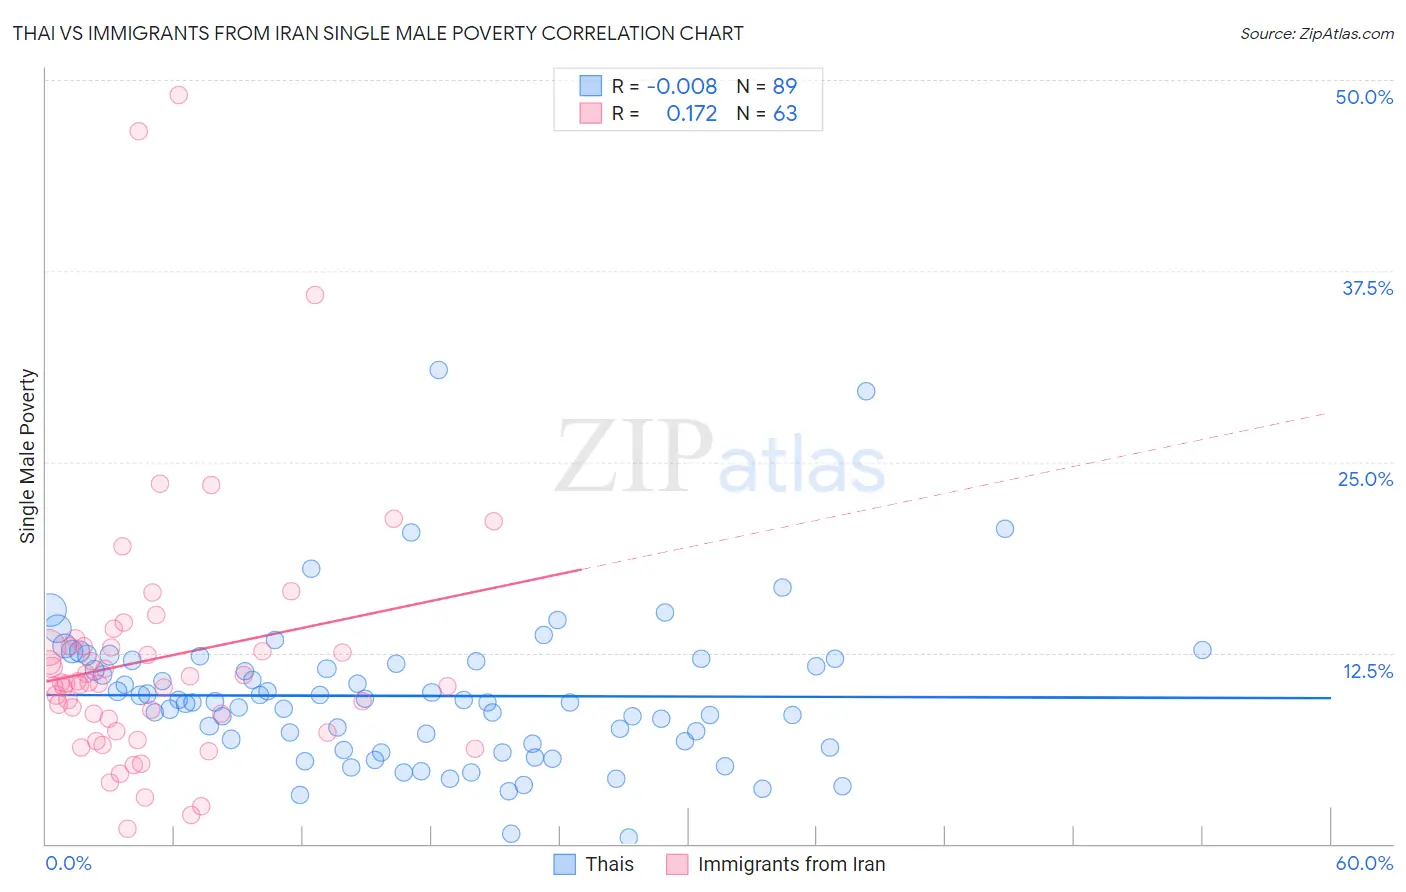
Thai vs Immigrants from Iran Single Male Poverty Correlation Chart
The statistical analysis conducted on geographies consisting of 412,300,186 people shows no correlation between the proportion of Thais and poverty level among single males in the United States with a correlation coefficient (R) of -0.008 and weighted average of 10.8%. Similarly, the statistical analysis conducted on geographies consisting of 253,206,920 people shows a poor positive correlation between the proportion of Immigrants from Iran and poverty level among single males in the United States with a correlation coefficient (R) of 0.172 and weighted average of 11.4%, a difference of 6.1%.
Single Male Poverty Correlation Summary
| Measurement | Thai | Immigrants from Iran |
| Minimum | 0.44% | 0.97% |
| Maximum | 31.0% | 49.0% |
| Range | 30.6% | 48.0% |
| Mean | 9.7% | 12.1% |
| Median | 9.3% | 10.5% |
| Interquartile 25% (IQ1) | 6.4% | 7.4% |
| Interquartile 75% (IQ3) | 12.0% | 12.9% |
| Interquartile Range (IQR) | 5.6% | 5.6% |
| Standard Deviation (Sample) | 5.0% | 8.7% |
| Standard Deviation (Population) | 4.9% | 8.6% |
Similar Demographics by Single Male Poverty
Demographics Similar to Thais by Single Male Poverty
In terms of single male poverty, the demographic groups most similar to Thais are Afghan (10.7%, a difference of 0.47%), Filipino (10.6%, a difference of 1.2%), Taiwanese (10.9%, a difference of 1.3%), Immigrants from Fiji (10.9%, a difference of 1.3%), and Immigrants from Philippines (10.9%, a difference of 1.3%).
| Demographics | Rating | Rank | Single Male Poverty |
| Assyrians/Chaldeans/Syriacs | 100.0 /100 | #1 | Exceptional 9.8% |
| Immigrants | Taiwan | 100.0 /100 | #2 | Exceptional 10.3% |
| Immigrants | India | 100.0 /100 | #3 | Exceptional 10.3% |
| Immigrants | Hong Kong | 100.0 /100 | #4 | Exceptional 10.4% |
| Tongans | 100.0 /100 | #5 | Exceptional 10.5% |
| Filipinos | 100.0 /100 | #6 | Exceptional 10.6% |
| Afghans | 100.0 /100 | #7 | Exceptional 10.7% |
| Thais | 100.0 /100 | #8 | Exceptional 10.8% |
| Taiwanese | 100.0 /100 | #9 | Exceptional 10.9% |
| Immigrants | Fiji | 100.0 /100 | #10 | Exceptional 10.9% |
| Immigrants | Philippines | 100.0 /100 | #11 | Exceptional 10.9% |
| Immigrants | Afghanistan | 100.0 /100 | #12 | Exceptional 10.9% |
| Immigrants | South Central Asia | 100.0 /100 | #13 | Exceptional 10.9% |
| Chinese | 100.0 /100 | #14 | Exceptional 11.0% |
| Koreans | 100.0 /100 | #15 | Exceptional 11.0% |
Demographics Similar to Immigrants from Iran by Single Male Poverty
In terms of single male poverty, the demographic groups most similar to Immigrants from Iran are Iranian (11.4%, a difference of 0.090%), Immigrants from Eastern Asia (11.4%, a difference of 0.090%), Immigrants from Egypt (11.4%, a difference of 0.15%), Immigrants from Vietnam (11.4%, a difference of 0.16%), and Immigrants from Ethiopia (11.4%, a difference of 0.20%).
| Demographics | Rating | Rank | Single Male Poverty |
| Indians (Asian) | 100.0 /100 | #24 | Exceptional 11.3% |
| Maltese | 100.0 /100 | #25 | Exceptional 11.3% |
| Immigrants | Japan | 100.0 /100 | #26 | Exceptional 11.3% |
| Immigrants | China | 100.0 /100 | #27 | Exceptional 11.4% |
| Immigrants | Asia | 100.0 /100 | #28 | Exceptional 11.4% |
| Immigrants | Egypt | 100.0 /100 | #29 | Exceptional 11.4% |
| Iranians | 100.0 /100 | #30 | Exceptional 11.4% |
| Immigrants | Iran | 100.0 /100 | #31 | Exceptional 11.4% |
| Immigrants | Eastern Asia | 100.0 /100 | #32 | Exceptional 11.4% |
| Immigrants | Vietnam | 100.0 /100 | #33 | Exceptional 11.4% |
| Immigrants | Ethiopia | 100.0 /100 | #34 | Exceptional 11.4% |
| Immigrants | South Eastern Asia | 100.0 /100 | #35 | Exceptional 11.4% |
| Immigrants | Serbia | 100.0 /100 | #36 | Exceptional 11.4% |
| Immigrants | Singapore | 100.0 /100 | #37 | Exceptional 11.4% |
| Sri Lankans | 100.0 /100 | #38 | Exceptional 11.5% |