Shoshone vs Aleut Unemployment Among Ages 55 to 59 years
COMPARE
Shoshone
Aleut
Unemployment Among Ages 55 to 59 years
Unemployment Among Ages 55 to 59 years Comparison
Shoshone
Aleuts
7.4%
UNEMPLOYMENT AMONG AGES 55 TO 59 YEARS
0.0/ 100
METRIC RATING
341st/ 347
METRIC RANK
6.4%
UNEMPLOYMENT AMONG AGES 55 TO 59 YEARS
0.0/ 100
METRIC RATING
332nd/ 347
METRIC RANK
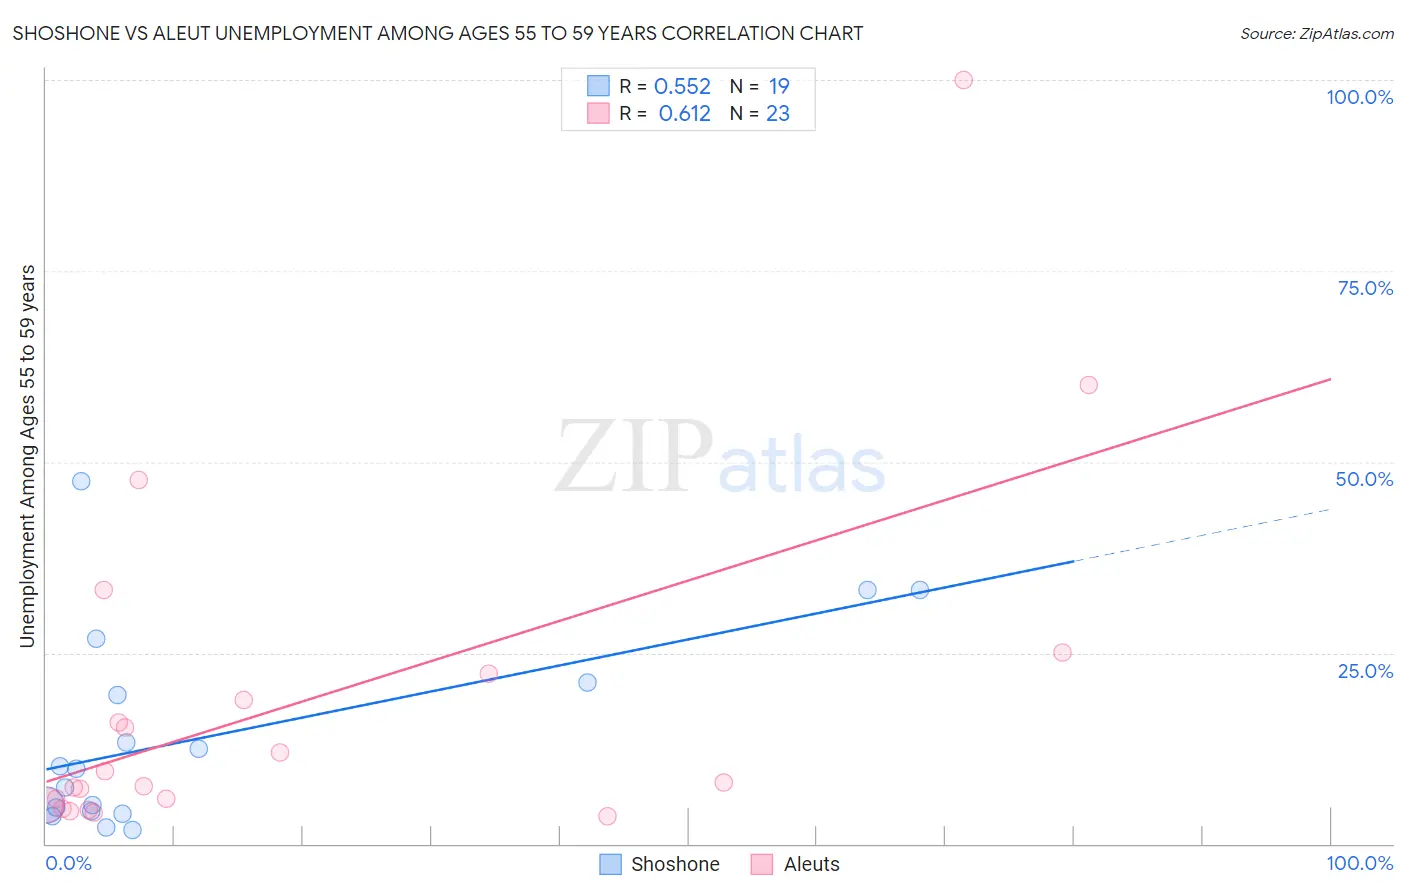
Shoshone vs Aleut Unemployment Among Ages 55 to 59 years Correlation Chart
The statistical analysis conducted on geographies consisting of 64,919,646 people shows a substantial positive correlation between the proportion of Shoshone and unemployment rate among population between the ages 55 and 59 in the United States with a correlation coefficient (R) of 0.552 and weighted average of 7.4%. Similarly, the statistical analysis conducted on geographies consisting of 60,136,595 people shows a significant positive correlation between the proportion of Aleuts and unemployment rate among population between the ages 55 and 59 in the United States with a correlation coefficient (R) of 0.612 and weighted average of 6.4%, a difference of 14.5%.
Unemployment Among Ages 55 to 59 years Correlation Summary
| Measurement | Shoshone | Aleut |
| Minimum | 1.8% | 3.6% |
| Maximum | 47.4% | 100.0% |
| Range | 45.6% | 96.4% |
| Mean | 14.0% | 18.6% |
| Median | 9.9% | 8.0% |
| Interquartile 25% (IQ1) | 4.2% | 5.1% |
| Interquartile 75% (IQ3) | 21.1% | 22.2% |
| Interquartile Range (IQR) | 16.9% | 17.1% |
| Standard Deviation (Sample) | 13.0% | 23.0% |
| Standard Deviation (Population) | 12.6% | 22.5% |
Demographics Similar to Shoshone and Aleuts by Unemployment Among Ages 55 to 59 years
In terms of unemployment among ages 55 to 59 years, the demographic groups most similar to Shoshone are Alaskan Athabascan (7.1%, a difference of 3.3%), Puerto Rican (7.0%, a difference of 5.9%), Immigrants from Yemen (6.9%, a difference of 7.0%), Paiute (6.8%, a difference of 9.1%), and Navajo (6.7%, a difference of 9.7%). Similarly, the demographic groups most similar to Aleuts are Immigrants from Dominican Republic (6.3%, a difference of 2.4%), Pima (6.6%, a difference of 2.8%), Alaska Native (6.2%, a difference of 3.1%), Dominican (6.2%, a difference of 3.6%), and Pueblo (6.7%, a difference of 4.1%).
| Demographics | Rating | Rank | Unemployment Among Ages 55 to 59 years |
| Natives/Alaskans | 0.0 /100 | #326 | Tragic 6.0% |
| Arapaho | 0.0 /100 | #327 | Tragic 6.1% |
| Yuman | 0.0 /100 | #328 | Tragic 6.1% |
| Dominicans | 0.0 /100 | #329 | Tragic 6.2% |
| Alaska Natives | 0.0 /100 | #330 | Tragic 6.2% |
| Immigrants | Dominican Republic | 0.0 /100 | #331 | Tragic 6.3% |
| Aleuts | 0.0 /100 | #332 | Tragic 6.4% |
| Pima | 0.0 /100 | #333 | Tragic 6.6% |
| Pueblo | 0.0 /100 | #334 | Tragic 6.7% |
| Colville | 0.0 /100 | #335 | Tragic 6.7% |
| Navajo | 0.0 /100 | #336 | Tragic 6.7% |
| Paiute | 0.0 /100 | #337 | Tragic 6.8% |
| Immigrants | Yemen | 0.0 /100 | #338 | Tragic 6.9% |
| Puerto Ricans | 0.0 /100 | #339 | Tragic 7.0% |
| Alaskan Athabascans | 0.0 /100 | #340 | Tragic 7.1% |
| Shoshone | 0.0 /100 | #341 | Tragic 7.4% |
| Hopi | 0.0 /100 | #342 | Tragic 8.1% |
| Yakama | 0.0 /100 | #343 | Tragic 8.9% |
| Inupiat | 0.0 /100 | #344 | Tragic 9.0% |
| Tohono O'odham | 0.0 /100 | #345 | Tragic 9.3% |
| Menominee | 0.0 /100 | #346 | Tragic 10.5% |