Shoshone vs Aleut 4th Grade
COMPARE
Shoshone
Aleut
4th Grade
4th Grade Comparison
Shoshone
Aleuts
97.9%
4TH GRADE
98.7/ 100
METRIC RATING
94th/ 347
METRIC RANK
98.2%
4TH GRADE
99.9/ 100
METRIC RATING
38th/ 347
METRIC RANK
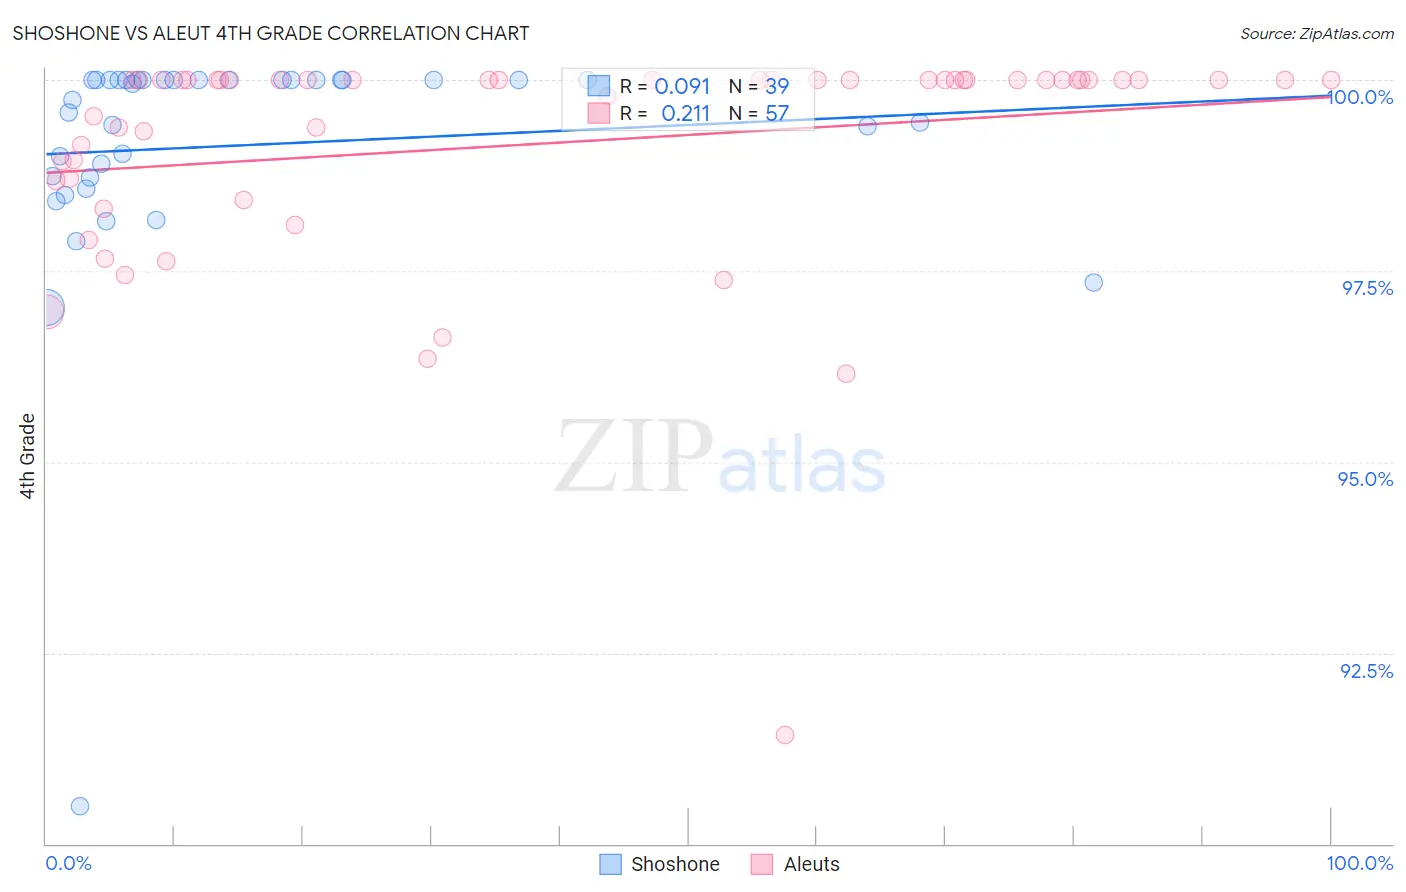
Shoshone vs Aleut 4th Grade Correlation Chart
The statistical analysis conducted on geographies consisting of 66,625,086 people shows a slight positive correlation between the proportion of Shoshone and percentage of population with at least 4th grade education in the United States with a correlation coefficient (R) of 0.091 and weighted average of 97.9%. Similarly, the statistical analysis conducted on geographies consisting of 61,781,058 people shows a weak positive correlation between the proportion of Aleuts and percentage of population with at least 4th grade education in the United States with a correlation coefficient (R) of 0.211 and weighted average of 98.2%, a difference of 0.29%.
4th Grade Correlation Summary
| Measurement | Shoshone | Aleut |
| Minimum | 90.5% | 91.4% |
| Maximum | 100.0% | 100.0% |
| Range | 9.5% | 8.6% |
| Mean | 99.1% | 99.2% |
| Median | 99.9% | 100.0% |
| Interquartile 25% (IQ1) | 98.7% | 98.7% |
| Interquartile 75% (IQ3) | 100.0% | 100.0% |
| Interquartile Range (IQR) | 1.3% | 1.3% |
| Standard Deviation (Sample) | 1.6% | 1.5% |
| Standard Deviation (Population) | 1.6% | 1.5% |
Similar Demographics by 4th Grade
Demographics Similar to Shoshone by 4th Grade
In terms of 4th grade, the demographic groups most similar to Shoshone are Immigrants from South Africa (97.9%, a difference of 0.0%), Delaware (97.9%, a difference of 0.0%), Immigrants from Denmark (97.9%, a difference of 0.0%), Immigrants from Sweden (97.9%, a difference of 0.0%), and Immigrants from Western Europe (97.9%, a difference of 0.0%).
| Demographics | Rating | Rank | 4th Grade |
| Zimbabweans | 98.8 /100 | #87 | Exceptional 97.9% |
| Immigrants | South Africa | 98.8 /100 | #88 | Exceptional 97.9% |
| Delaware | 98.8 /100 | #89 | Exceptional 97.9% |
| Immigrants | Denmark | 98.7 /100 | #90 | Exceptional 97.9% |
| Immigrants | Sweden | 98.7 /100 | #91 | Exceptional 97.9% |
| Immigrants | Western Europe | 98.7 /100 | #92 | Exceptional 97.9% |
| Immigrants | Ireland | 98.7 /100 | #93 | Exceptional 97.9% |
| Shoshone | 98.7 /100 | #94 | Exceptional 97.9% |
| Immigrants | Germany | 98.5 /100 | #95 | Exceptional 97.9% |
| Romanians | 98.4 /100 | #96 | Exceptional 97.9% |
| Cheyenne | 98.4 /100 | #97 | Exceptional 97.9% |
| South Africans | 98.2 /100 | #98 | Exceptional 97.9% |
| Turks | 98.2 /100 | #99 | Exceptional 97.9% |
| Yugoslavians | 98.1 /100 | #100 | Exceptional 97.9% |
| Cree | 98.1 /100 | #101 | Exceptional 97.9% |
Demographics Similar to Aleuts by 4th Grade
In terms of 4th grade, the demographic groups most similar to Aleuts are Latvian (98.2%, a difference of 0.0%), Belgian (98.2%, a difference of 0.010%), Luxembourger (98.2%, a difference of 0.010%), British (98.2%, a difference of 0.020%), and Eastern European (98.2%, a difference of 0.020%).
| Demographics | Rating | Rank | 4th Grade |
| Europeans | 100.0 /100 | #31 | Exceptional 98.3% |
| Chinese | 100.0 /100 | #32 | Exceptional 98.3% |
| Swiss | 100.0 /100 | #33 | Exceptional 98.2% |
| Chippewa | 100.0 /100 | #34 | Exceptional 98.2% |
| Italians | 100.0 /100 | #35 | Exceptional 98.2% |
| British | 100.0 /100 | #36 | Exceptional 98.2% |
| Latvians | 99.9 /100 | #37 | Exceptional 98.2% |
| Aleuts | 99.9 /100 | #38 | Exceptional 98.2% |
| Belgians | 99.9 /100 | #39 | Exceptional 98.2% |
| Luxembourgers | 99.9 /100 | #40 | Exceptional 98.2% |
| Eastern Europeans | 99.9 /100 | #41 | Exceptional 98.2% |
| Hungarians | 99.9 /100 | #42 | Exceptional 98.2% |
| Northern Europeans | 99.9 /100 | #43 | Exceptional 98.2% |
| Native Hawaiians | 99.9 /100 | #44 | Exceptional 98.1% |
| Czechoslovakians | 99.9 /100 | #45 | Exceptional 98.1% |