Shoshone vs Aleut Householder Income Ages 25 - 44 years
COMPARE
Shoshone
Aleut
Householder Income Ages 25 - 44 years
Householder Income Ages 25 - 44 years Comparison
Shoshone
Aleuts
$82,062
HOUSEHOLDER INCOME AGES 25 - 44 YEARS
0.1/ 100
METRIC RATING
289th/ 347
METRIC RANK
$91,370
HOUSEHOLDER INCOME AGES 25 - 44 YEARS
14.5/ 100
METRIC RATING
206th/ 347
METRIC RANK
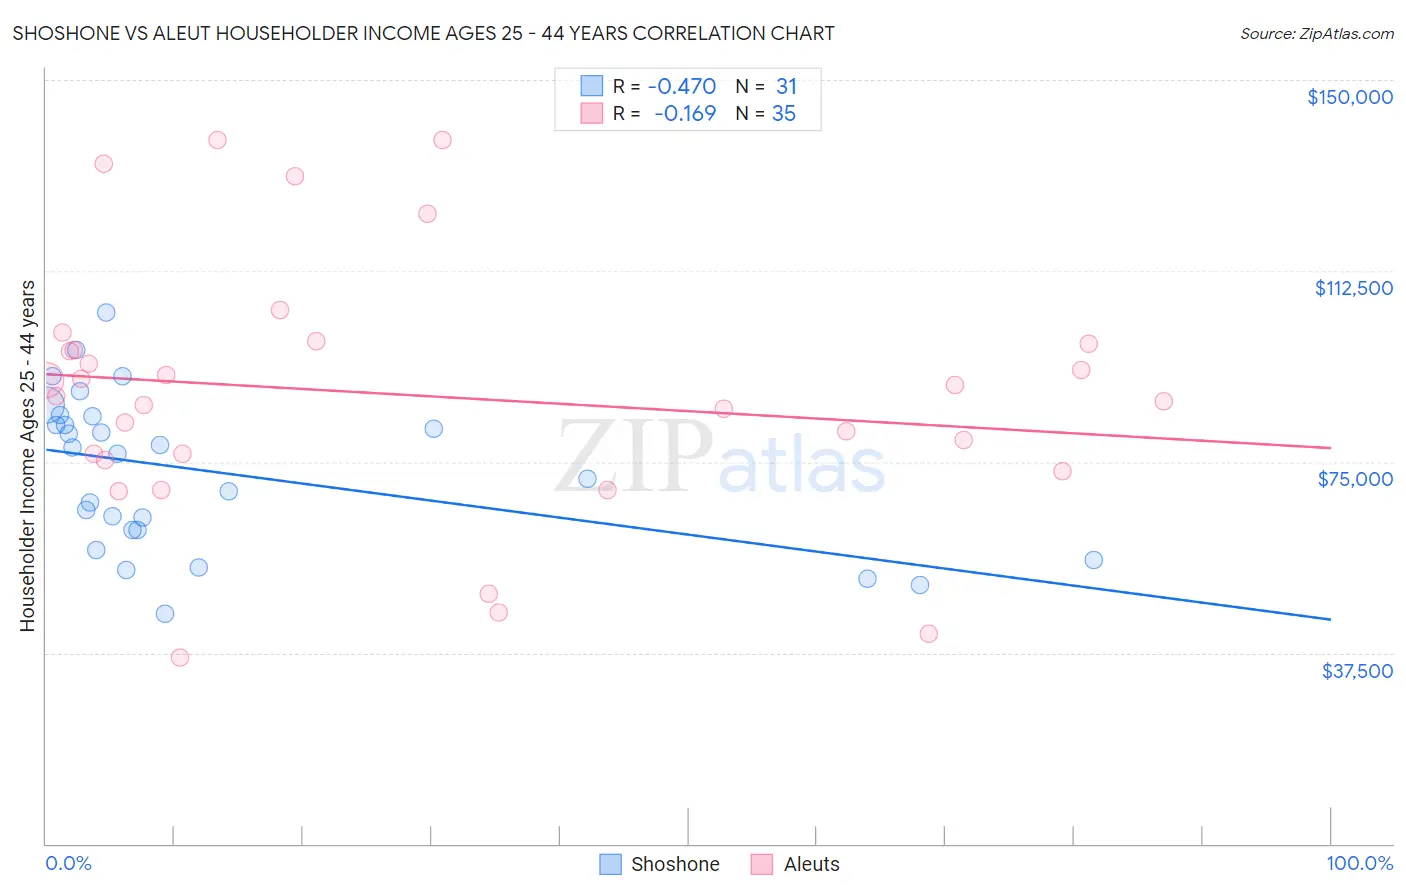
Shoshone vs Aleut Householder Income Ages 25 - 44 years Correlation Chart
The statistical analysis conducted on geographies consisting of 66,542,705 people shows a moderate negative correlation between the proportion of Shoshone and household income with householder between the ages 25 and 44 in the United States with a correlation coefficient (R) of -0.470 and weighted average of $82,062. Similarly, the statistical analysis conducted on geographies consisting of 61,739,915 people shows a poor negative correlation between the proportion of Aleuts and household income with householder between the ages 25 and 44 in the United States with a correlation coefficient (R) of -0.169 and weighted average of $91,370, a difference of 11.3%.
Householder Income Ages 25 - 44 years Correlation Summary
| Measurement | Shoshone | Aleut |
| Minimum | $45,294 | $36,667 |
| Maximum | $104,318 | $138,313 |
| Range | $59,024 | $101,646 |
| Mean | $72,987 | $88,134 |
| Median | $76,509 | $88,006 |
| Interquartile 25% (IQ1) | $61,583 | $75,410 |
| Interquartile 75% (IQ3) | $83,906 | $98,125 |
| Interquartile Range (IQR) | $22,323 | $22,715 |
| Standard Deviation (Sample) | $15,076 | $24,944 |
| Standard Deviation (Population) | $14,831 | $24,585 |
Similar Demographics by Householder Income Ages 25 - 44 years
Demographics Similar to Shoshone by Householder Income Ages 25 - 44 years
In terms of householder income ages 25 - 44 years, the demographic groups most similar to Shoshone are Liberian ($82,005, a difference of 0.070%), Comanche ($82,152, a difference of 0.11%), Ute ($82,166, a difference of 0.13%), Immigrants from Latin America ($82,166, a difference of 0.13%), and Immigrants from Somalia ($82,188, a difference of 0.15%).
| Demographics | Rating | Rank | Householder Income Ages 25 - 44 years |
| Central American Indians | 0.1 /100 | #282 | Tragic $82,355 |
| Guatemalans | 0.1 /100 | #283 | Tragic $82,331 |
| Immigrants | Middle Africa | 0.1 /100 | #284 | Tragic $82,254 |
| Immigrants | Somalia | 0.1 /100 | #285 | Tragic $82,188 |
| Ute | 0.1 /100 | #286 | Tragic $82,166 |
| Immigrants | Latin America | 0.1 /100 | #287 | Tragic $82,166 |
| Comanche | 0.1 /100 | #288 | Tragic $82,152 |
| Shoshone | 0.1 /100 | #289 | Tragic $82,062 |
| Liberians | 0.1 /100 | #290 | Tragic $82,005 |
| Potawatomi | 0.1 /100 | #291 | Tragic $81,774 |
| Yaqui | 0.1 /100 | #292 | Tragic $81,656 |
| Blackfeet | 0.1 /100 | #293 | Tragic $81,531 |
| Cubans | 0.1 /100 | #294 | Tragic $81,483 |
| Bangladeshis | 0.1 /100 | #295 | Tragic $81,363 |
| Immigrants | Dominica | 0.1 /100 | #296 | Tragic $81,351 |
Demographics Similar to Aleuts by Householder Income Ages 25 - 44 years
In terms of householder income ages 25 - 44 years, the demographic groups most similar to Aleuts are Yugoslavian ($91,368, a difference of 0.0%), Immigrants from Thailand ($91,337, a difference of 0.040%), Immigrants from Eastern Africa ($91,458, a difference of 0.10%), Nepalese ($91,498, a difference of 0.14%), and Immigrants from Cambodia ($91,533, a difference of 0.18%).
| Demographics | Rating | Rank | Householder Income Ages 25 - 44 years |
| Kenyans | 16.8 /100 | #199 | Poor $91,684 |
| Whites/Caucasians | 16.7 /100 | #200 | Poor $91,668 |
| Japanese | 16.4 /100 | #201 | Poor $91,624 |
| Ecuadorians | 16.0 /100 | #202 | Poor $91,574 |
| Immigrants | Cambodia | 15.7 /100 | #203 | Poor $91,533 |
| Nepalese | 15.4 /100 | #204 | Poor $91,498 |
| Immigrants | Eastern Africa | 15.2 /100 | #205 | Poor $91,458 |
| Aleuts | 14.5 /100 | #206 | Poor $91,370 |
| Yugoslavians | 14.5 /100 | #207 | Poor $91,368 |
| Immigrants | Thailand | 14.3 /100 | #208 | Poor $91,337 |
| Immigrants | Uruguay | 13.2 /100 | #209 | Poor $91,171 |
| Immigrants | Kenya | 10.9 /100 | #210 | Poor $90,767 |
| Iraqis | 10.8 /100 | #211 | Poor $90,764 |
| Hawaiians | 10.6 /100 | #212 | Poor $90,722 |
| Immigrants | Bangladesh | 9.3 /100 | #213 | Tragic $90,448 |