Senegalese vs Immigrants from Latvia Family Poverty
COMPARE
Senegalese
Immigrants from Latvia
Family Poverty
Family Poverty Comparison
Senegalese
Immigrants from Latvia
11.5%
FAMILY POVERTY
0.0/ 100
METRIC RATING
286th/ 347
METRIC RANK
7.9%
FAMILY POVERTY
98.0/ 100
METRIC RATING
76th/ 347
METRIC RANK
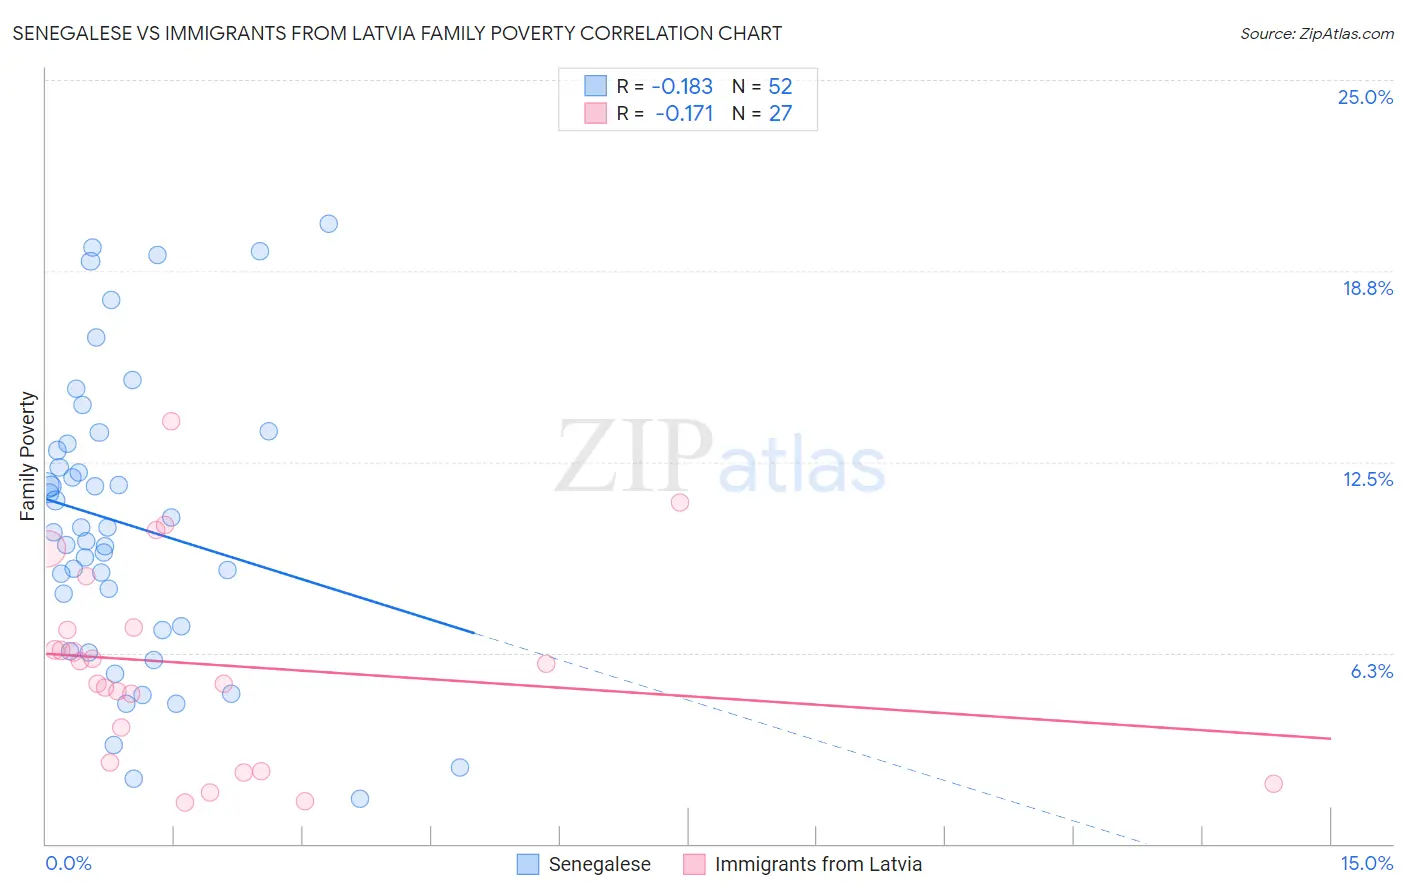
Senegalese vs Immigrants from Latvia Family Poverty Correlation Chart
The statistical analysis conducted on geographies consisting of 78,085,105 people shows a poor negative correlation between the proportion of Senegalese and poverty level among families in the United States with a correlation coefficient (R) of -0.183 and weighted average of 11.5%. Similarly, the statistical analysis conducted on geographies consisting of 113,662,762 people shows a poor negative correlation between the proportion of Immigrants from Latvia and poverty level among families in the United States with a correlation coefficient (R) of -0.171 and weighted average of 7.9%, a difference of 45.8%.
Family Poverty Correlation Summary
| Measurement | Senegalese | Immigrants from Latvia |
| Minimum | 1.5% | 1.4% |
| Maximum | 20.3% | 13.8% |
| Range | 18.9% | 12.5% |
| Mean | 10.5% | 5.9% |
| Median | 10.3% | 5.9% |
| Interquartile 25% (IQ1) | 7.1% | 2.7% |
| Interquartile 75% (IQ3) | 13.0% | 7.1% |
| Interquartile Range (IQR) | 5.9% | 4.4% |
| Standard Deviation (Sample) | 4.7% | 3.2% |
| Standard Deviation (Population) | 4.7% | 3.2% |
Similar Demographics by Family Poverty
Demographics Similar to Senegalese by Family Poverty
In terms of family poverty, the demographic groups most similar to Senegalese are Vietnamese (11.5%, a difference of 0.27%), Immigrants from Belize (11.5%, a difference of 0.46%), Immigrants from Barbados (11.5%, a difference of 0.51%), West Indian (11.5%, a difference of 0.52%), and Haitian (11.5%, a difference of 0.58%).
| Demographics | Rating | Rank | Family Poverty |
| Blackfeet | 0.0 /100 | #279 | Tragic 11.3% |
| Belizeans | 0.0 /100 | #280 | Tragic 11.3% |
| Immigrants | West Indies | 0.0 /100 | #281 | Tragic 11.3% |
| Immigrants | Cuba | 0.0 /100 | #282 | Tragic 11.3% |
| Indonesians | 0.0 /100 | #283 | Tragic 11.3% |
| Yaqui | 0.0 /100 | #284 | Tragic 11.3% |
| Barbadians | 0.0 /100 | #285 | Tragic 11.3% |
| Senegalese | 0.0 /100 | #286 | Tragic 11.5% |
| Vietnamese | 0.0 /100 | #287 | Tragic 11.5% |
| Immigrants | Belize | 0.0 /100 | #288 | Tragic 11.5% |
| Immigrants | Barbados | 0.0 /100 | #289 | Tragic 11.5% |
| West Indians | 0.0 /100 | #290 | Tragic 11.5% |
| Haitians | 0.0 /100 | #291 | Tragic 11.5% |
| Immigrants | Somalia | 0.0 /100 | #292 | Tragic 11.5% |
| Immigrants | Cabo Verde | 0.0 /100 | #293 | Tragic 11.6% |
Demographics Similar to Immigrants from Latvia by Family Poverty
In terms of family poverty, the demographic groups most similar to Immigrants from Latvia are Ukrainian (7.9%, a difference of 0.010%), Immigrants from North America (7.9%, a difference of 0.12%), Immigrants from Europe (7.9%, a difference of 0.20%), Immigrants from Croatia (7.8%, a difference of 0.23%), and English (7.9%, a difference of 0.26%).
| Demographics | Rating | Rank | Family Poverty |
| Immigrants | Belgium | 98.2 /100 | #69 | Exceptional 7.8% |
| Immigrants | Canada | 98.2 /100 | #70 | Exceptional 7.8% |
| Cambodians | 98.2 /100 | #71 | Exceptional 7.8% |
| Immigrants | Romania | 98.2 /100 | #72 | Exceptional 7.8% |
| Austrians | 98.2 /100 | #73 | Exceptional 7.8% |
| Immigrants | China | 98.1 /100 | #74 | Exceptional 7.8% |
| Immigrants | Croatia | 98.1 /100 | #75 | Exceptional 7.8% |
| Immigrants | Latvia | 98.0 /100 | #76 | Exceptional 7.9% |
| Ukrainians | 98.0 /100 | #77 | Exceptional 7.9% |
| Immigrants | North America | 97.9 /100 | #78 | Exceptional 7.9% |
| Immigrants | Europe | 97.8 /100 | #79 | Exceptional 7.9% |
| English | 97.8 /100 | #80 | Exceptional 7.9% |
| Irish | 97.8 /100 | #81 | Exceptional 7.9% |
| Immigrants | Poland | 97.8 /100 | #82 | Exceptional 7.9% |
| Slovaks | 97.7 /100 | #83 | Exceptional 7.9% |