Senegalese vs Immigrants from Portugal Family Poverty
COMPARE
Senegalese
Immigrants from Portugal
Family Poverty
Family Poverty Comparison
Senegalese
Immigrants from Portugal
11.5%
FAMILY POVERTY
0.0/ 100
METRIC RATING
286th/ 347
METRIC RANK
9.4%
FAMILY POVERTY
20.5/ 100
METRIC RATING
201st/ 347
METRIC RANK
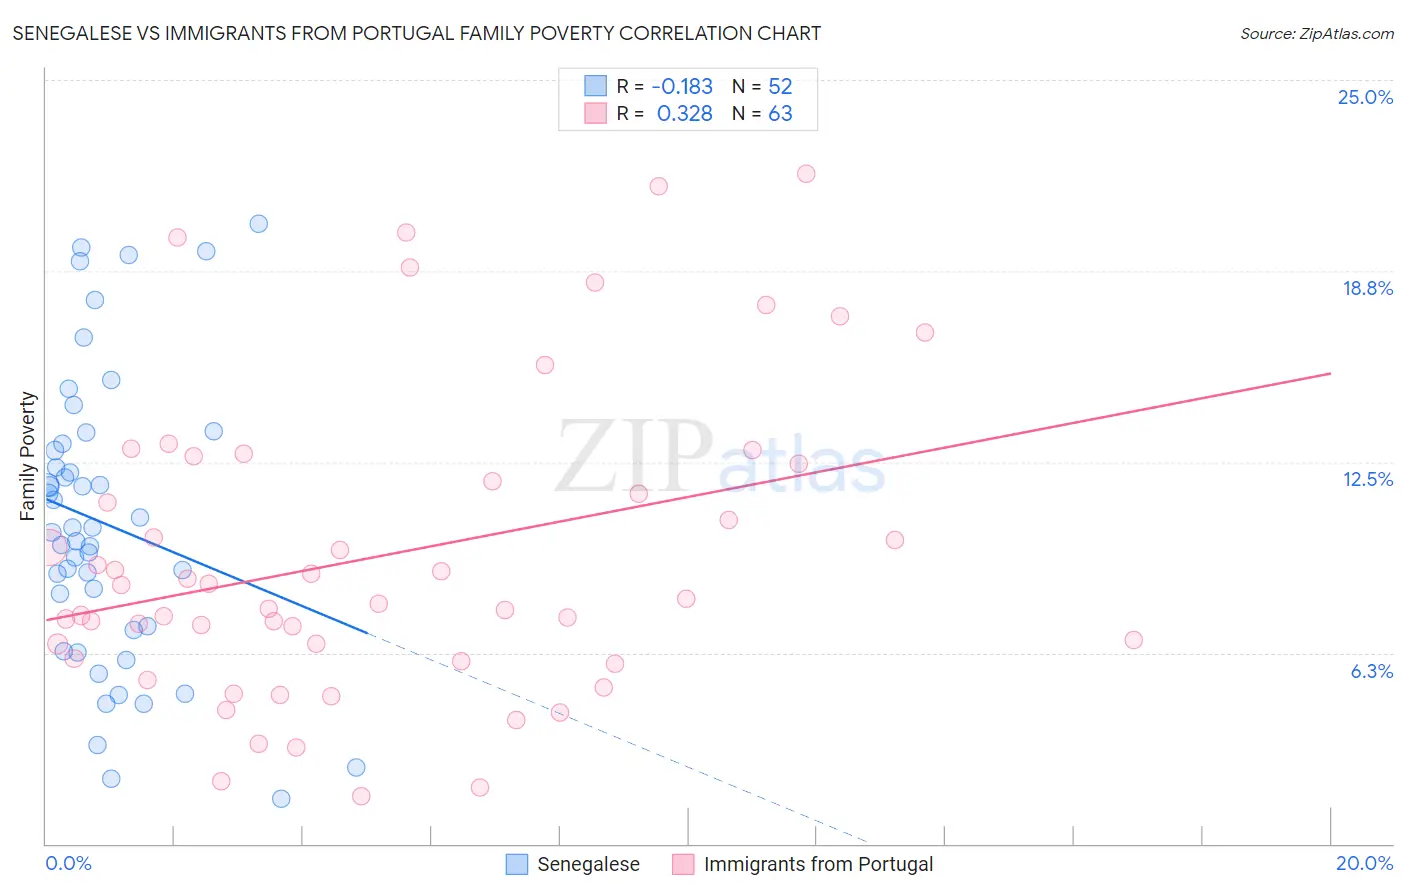
Senegalese vs Immigrants from Portugal Family Poverty Correlation Chart
The statistical analysis conducted on geographies consisting of 78,085,105 people shows a poor negative correlation between the proportion of Senegalese and poverty level among families in the United States with a correlation coefficient (R) of -0.183 and weighted average of 11.5%. Similarly, the statistical analysis conducted on geographies consisting of 174,489,914 people shows a mild positive correlation between the proportion of Immigrants from Portugal and poverty level among families in the United States with a correlation coefficient (R) of 0.328 and weighted average of 9.4%, a difference of 21.9%.
Family Poverty Correlation Summary
| Measurement | Senegalese | Immigrants from Portugal |
| Minimum | 1.5% | 1.6% |
| Maximum | 20.3% | 21.9% |
| Range | 18.9% | 20.4% |
| Mean | 10.5% | 9.4% |
| Median | 10.3% | 8.0% |
| Interquartile 25% (IQ1) | 7.1% | 6.1% |
| Interquartile 75% (IQ3) | 13.0% | 12.5% |
| Interquartile Range (IQR) | 5.9% | 6.4% |
| Standard Deviation (Sample) | 4.7% | 5.0% |
| Standard Deviation (Population) | 4.7% | 4.9% |
Similar Demographics by Family Poverty
Demographics Similar to Senegalese by Family Poverty
In terms of family poverty, the demographic groups most similar to Senegalese are Vietnamese (11.5%, a difference of 0.27%), Immigrants from Belize (11.5%, a difference of 0.46%), Immigrants from Barbados (11.5%, a difference of 0.51%), West Indian (11.5%, a difference of 0.52%), and Haitian (11.5%, a difference of 0.58%).
| Demographics | Rating | Rank | Family Poverty |
| Blackfeet | 0.0 /100 | #279 | Tragic 11.3% |
| Belizeans | 0.0 /100 | #280 | Tragic 11.3% |
| Immigrants | West Indies | 0.0 /100 | #281 | Tragic 11.3% |
| Immigrants | Cuba | 0.0 /100 | #282 | Tragic 11.3% |
| Indonesians | 0.0 /100 | #283 | Tragic 11.3% |
| Yaqui | 0.0 /100 | #284 | Tragic 11.3% |
| Barbadians | 0.0 /100 | #285 | Tragic 11.3% |
| Senegalese | 0.0 /100 | #286 | Tragic 11.5% |
| Vietnamese | 0.0 /100 | #287 | Tragic 11.5% |
| Immigrants | Belize | 0.0 /100 | #288 | Tragic 11.5% |
| Immigrants | Barbados | 0.0 /100 | #289 | Tragic 11.5% |
| West Indians | 0.0 /100 | #290 | Tragic 11.5% |
| Haitians | 0.0 /100 | #291 | Tragic 11.5% |
| Immigrants | Somalia | 0.0 /100 | #292 | Tragic 11.5% |
| Immigrants | Cabo Verde | 0.0 /100 | #293 | Tragic 11.6% |
Demographics Similar to Immigrants from Portugal by Family Poverty
In terms of family poverty, the demographic groups most similar to Immigrants from Portugal are Immigrants from Sierra Leone (9.4%, a difference of 0.17%), German Russian (9.4%, a difference of 0.21%), Immigrants from Costa Rica (9.4%, a difference of 0.23%), Immigrants from Lebanon (9.4%, a difference of 0.31%), and Spaniard (9.4%, a difference of 0.42%).
| Demographics | Rating | Rank | Family Poverty |
| South Americans | 28.1 /100 | #194 | Fair 9.3% |
| Venezuelans | 27.4 /100 | #195 | Fair 9.3% |
| Immigrants | Venezuela | 26.1 /100 | #196 | Fair 9.3% |
| Immigrants | Colombia | 24.4 /100 | #197 | Fair 9.3% |
| Iraqis | 24.2 /100 | #198 | Fair 9.3% |
| Spaniards | 22.8 /100 | #199 | Fair 9.4% |
| Immigrants | Costa Rica | 21.7 /100 | #200 | Fair 9.4% |
| Immigrants | Portugal | 20.5 /100 | #201 | Fair 9.4% |
| Immigrants | Sierra Leone | 19.6 /100 | #202 | Poor 9.4% |
| German Russians | 19.4 /100 | #203 | Poor 9.4% |
| Immigrants | Lebanon | 18.9 /100 | #204 | Poor 9.4% |
| Aleuts | 18.0 /100 | #205 | Poor 9.5% |
| Immigrants | South America | 18.0 /100 | #206 | Poor 9.5% |
| Sierra Leoneans | 15.6 /100 | #207 | Poor 9.5% |
| Immigrants | Eastern Africa | 15.1 /100 | #208 | Poor 9.5% |