Senegalese vs Romanian Family Poverty
COMPARE
Senegalese
Romanian
Family Poverty
Family Poverty Comparison
Senegalese
Romanians
11.5%
FAMILY POVERTY
0.0/ 100
METRIC RATING
286th/ 347
METRIC RANK
8.2%
FAMILY POVERTY
94.7/ 100
METRIC RATING
110th/ 347
METRIC RANK
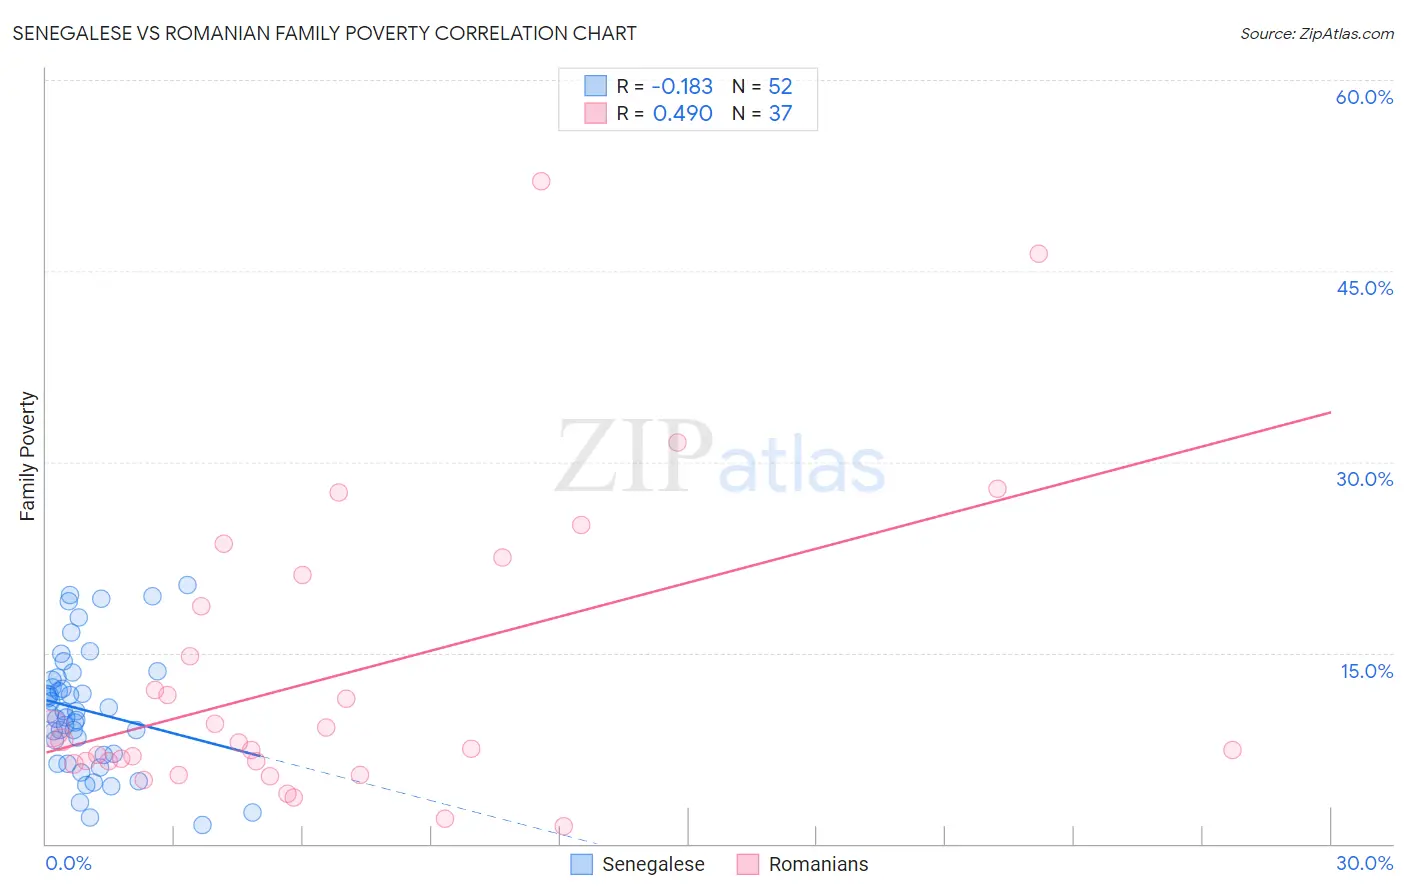
Senegalese vs Romanian Family Poverty Correlation Chart
The statistical analysis conducted on geographies consisting of 78,085,105 people shows a poor negative correlation between the proportion of Senegalese and poverty level among families in the United States with a correlation coefficient (R) of -0.183 and weighted average of 11.5%. Similarly, the statistical analysis conducted on geographies consisting of 376,889,400 people shows a moderate positive correlation between the proportion of Romanians and poverty level among families in the United States with a correlation coefficient (R) of 0.490 and weighted average of 8.2%, a difference of 40.5%.
Family Poverty Correlation Summary
| Measurement | Senegalese | Romanian |
| Minimum | 1.5% | 1.4% |
| Maximum | 20.3% | 52.0% |
| Range | 18.9% | 50.6% |
| Mean | 10.5% | 13.2% |
| Median | 10.3% | 7.9% |
| Interquartile 25% (IQ1) | 7.1% | 6.4% |
| Interquartile 75% (IQ3) | 13.0% | 19.9% |
| Interquartile Range (IQR) | 5.9% | 13.5% |
| Standard Deviation (Sample) | 4.7% | 11.8% |
| Standard Deviation (Population) | 4.7% | 11.6% |
Similar Demographics by Family Poverty
Demographics Similar to Senegalese by Family Poverty
In terms of family poverty, the demographic groups most similar to Senegalese are Vietnamese (11.5%, a difference of 0.27%), Immigrants from Belize (11.5%, a difference of 0.46%), Immigrants from Barbados (11.5%, a difference of 0.51%), West Indian (11.5%, a difference of 0.52%), and Haitian (11.5%, a difference of 0.58%).
| Demographics | Rating | Rank | Family Poverty |
| Blackfeet | 0.0 /100 | #279 | Tragic 11.3% |
| Belizeans | 0.0 /100 | #280 | Tragic 11.3% |
| Immigrants | West Indies | 0.0 /100 | #281 | Tragic 11.3% |
| Immigrants | Cuba | 0.0 /100 | #282 | Tragic 11.3% |
| Indonesians | 0.0 /100 | #283 | Tragic 11.3% |
| Yaqui | 0.0 /100 | #284 | Tragic 11.3% |
| Barbadians | 0.0 /100 | #285 | Tragic 11.3% |
| Senegalese | 0.0 /100 | #286 | Tragic 11.5% |
| Vietnamese | 0.0 /100 | #287 | Tragic 11.5% |
| Immigrants | Belize | 0.0 /100 | #288 | Tragic 11.5% |
| Immigrants | Barbados | 0.0 /100 | #289 | Tragic 11.5% |
| West Indians | 0.0 /100 | #290 | Tragic 11.5% |
| Haitians | 0.0 /100 | #291 | Tragic 11.5% |
| Immigrants | Somalia | 0.0 /100 | #292 | Tragic 11.5% |
| Immigrants | Cabo Verde | 0.0 /100 | #293 | Tragic 11.6% |
Demographics Similar to Romanians by Family Poverty
In terms of family poverty, the demographic groups most similar to Romanians are Taiwanese (8.2%, a difference of 0.060%), Jordanian (8.2%, a difference of 0.090%), Immigrants from France (8.2%, a difference of 0.16%), Basque (8.1%, a difference of 0.18%), and French Canadian (8.1%, a difference of 0.27%).
| Demographics | Rating | Rank | Family Poverty |
| Immigrants | Eastern Europe | 95.6 /100 | #103 | Exceptional 8.1% |
| Slavs | 95.6 /100 | #104 | Exceptional 8.1% |
| Laotians | 95.6 /100 | #105 | Exceptional 8.1% |
| Egyptians | 95.1 /100 | #106 | Exceptional 8.1% |
| French Canadians | 95.0 /100 | #107 | Exceptional 8.1% |
| Basques | 94.9 /100 | #108 | Exceptional 8.1% |
| Jordanians | 94.8 /100 | #109 | Exceptional 8.2% |
| Romanians | 94.7 /100 | #110 | Exceptional 8.2% |
| Taiwanese | 94.6 /100 | #111 | Exceptional 8.2% |
| Immigrants | France | 94.4 /100 | #112 | Exceptional 8.2% |
| Canadians | 94.2 /100 | #113 | Exceptional 8.2% |
| Immigrants | Zimbabwe | 94.0 /100 | #114 | Exceptional 8.2% |
| Immigrants | Israel | 93.5 /100 | #115 | Exceptional 8.2% |
| South Africans | 93.4 /100 | #116 | Exceptional 8.2% |
| Immigrants | Russia | 93.2 /100 | #117 | Exceptional 8.2% |