Senegalese vs Immigrants from Latvia Single Mother Households
COMPARE
Senegalese
Immigrants from Latvia
Single Mother Households
Single Mother Households Comparison
Senegalese
Immigrants from Latvia
8.2%
SINGLE MOTHER HOUSEHOLDS
0.0/ 100
METRIC RATING
318th/ 347
METRIC RANK
5.5%
SINGLE MOTHER HOUSEHOLDS
99.2/ 100
METRIC RATING
49th/ 347
METRIC RANK
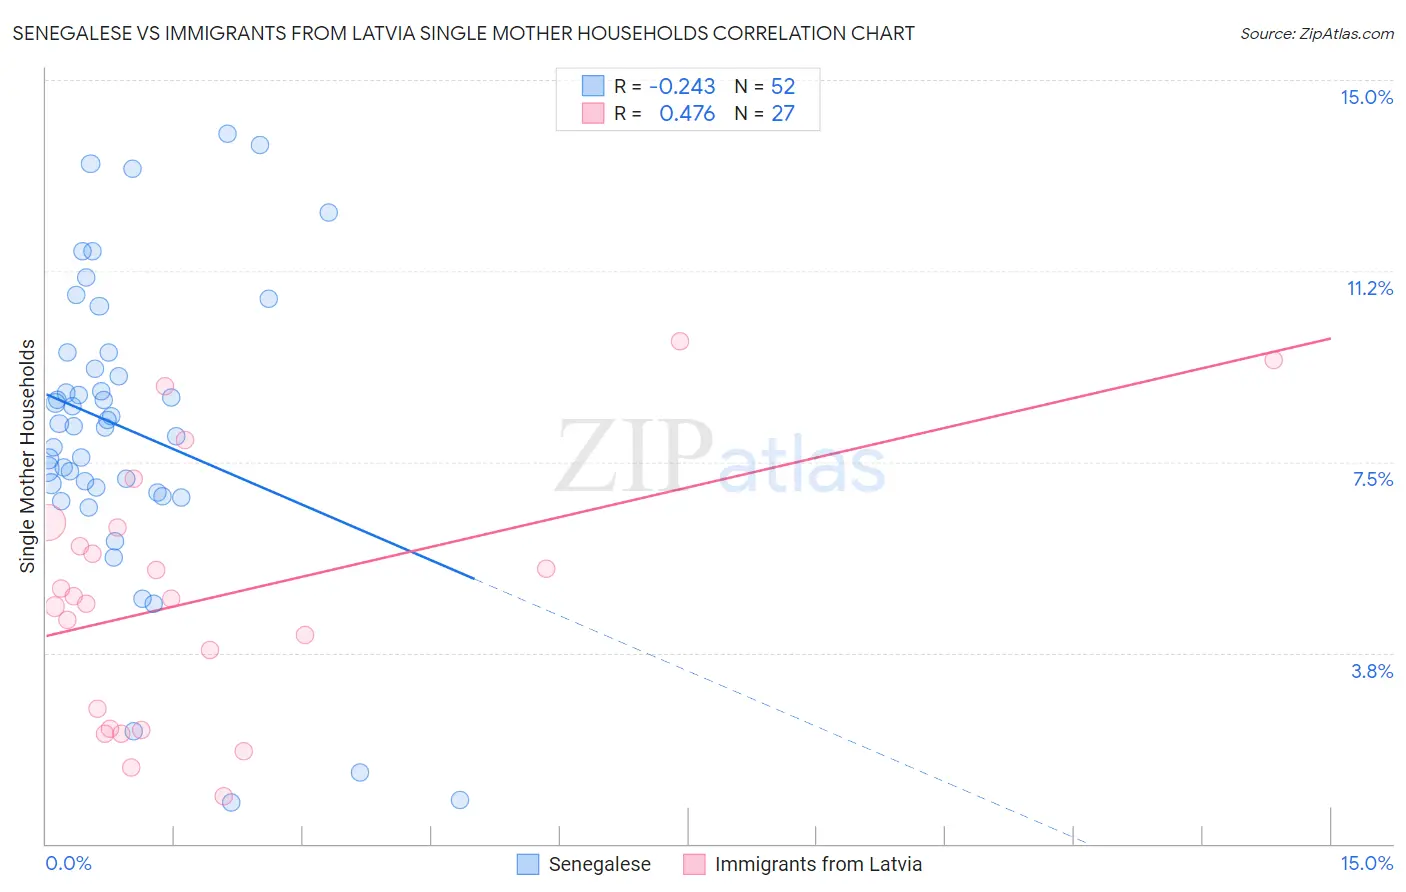
Senegalese vs Immigrants from Latvia Single Mother Households Correlation Chart
The statistical analysis conducted on geographies consisting of 78,081,080 people shows a weak negative correlation between the proportion of Senegalese and percentage of single mother households in the United States with a correlation coefficient (R) of -0.243 and weighted average of 8.2%. Similarly, the statistical analysis conducted on geographies consisting of 113,660,661 people shows a moderate positive correlation between the proportion of Immigrants from Latvia and percentage of single mother households in the United States with a correlation coefficient (R) of 0.476 and weighted average of 5.5%, a difference of 50.3%.
Single Mother Households Correlation Summary
| Measurement | Senegalese | Immigrants from Latvia |
| Minimum | 0.81% | 0.94% |
| Maximum | 13.9% | 9.9% |
| Range | 13.1% | 8.9% |
| Mean | 8.2% | 4.8% |
| Median | 8.2% | 4.8% |
| Interquartile 25% (IQ1) | 6.9% | 2.3% |
| Interquartile 75% (IQ3) | 9.5% | 6.2% |
| Interquartile Range (IQR) | 2.5% | 4.0% |
| Standard Deviation (Sample) | 2.9% | 2.4% |
| Standard Deviation (Population) | 2.9% | 2.4% |
Similar Demographics by Single Mother Households
Demographics Similar to Senegalese by Single Mother Households
In terms of single mother households, the demographic groups most similar to Senegalese are Jamaican (8.2%, a difference of 0.11%), Bahamian (8.3%, a difference of 0.23%), Immigrants from Senegal (8.3%, a difference of 0.47%), Pima (8.3%, a difference of 0.55%), and Immigrants from Honduras (8.2%, a difference of 0.56%).
| Demographics | Rating | Rank | Single Mother Households |
| Immigrants | Congo | 0.0 /100 | #311 | Tragic 8.1% |
| Bangladeshis | 0.0 /100 | #312 | Tragic 8.1% |
| Immigrants | Grenada | 0.0 /100 | #313 | Tragic 8.2% |
| Immigrants | Mexico | 0.0 /100 | #314 | Tragic 8.2% |
| Immigrants | Western Africa | 0.0 /100 | #315 | Tragic 8.2% |
| Africans | 0.0 /100 | #316 | Tragic 8.2% |
| Immigrants | Honduras | 0.0 /100 | #317 | Tragic 8.2% |
| Senegalese | 0.0 /100 | #318 | Tragic 8.2% |
| Jamaicans | 0.0 /100 | #319 | Tragic 8.2% |
| Bahamians | 0.0 /100 | #320 | Tragic 8.3% |
| Immigrants | Senegal | 0.0 /100 | #321 | Tragic 8.3% |
| Pima | 0.0 /100 | #322 | Tragic 8.3% |
| Haitians | 0.0 /100 | #323 | Tragic 8.3% |
| Immigrants | Jamaica | 0.0 /100 | #324 | Tragic 8.4% |
| Immigrants | Caribbean | 0.0 /100 | #325 | Tragic 8.4% |
Demographics Similar to Immigrants from Latvia by Single Mother Households
In terms of single mother households, the demographic groups most similar to Immigrants from Latvia are Turkish (5.5%, a difference of 0.030%), Immigrants from Scotland (5.5%, a difference of 0.19%), Immigrants from Belarus (5.5%, a difference of 0.21%), Norwegian (5.5%, a difference of 0.23%), and Swedish (5.5%, a difference of 0.27%).
| Demographics | Rating | Rank | Single Mother Households |
| Macedonians | 99.5 /100 | #42 | Exceptional 5.4% |
| Immigrants | South Central Asia | 99.5 /100 | #43 | Exceptional 5.4% |
| Lithuanians | 99.4 /100 | #44 | Exceptional 5.4% |
| Immigrants | Croatia | 99.4 /100 | #45 | Exceptional 5.4% |
| Croatians | 99.3 /100 | #46 | Exceptional 5.5% |
| Norwegians | 99.3 /100 | #47 | Exceptional 5.5% |
| Turks | 99.2 /100 | #48 | Exceptional 5.5% |
| Immigrants | Latvia | 99.2 /100 | #49 | Exceptional 5.5% |
| Immigrants | Scotland | 99.2 /100 | #50 | Exceptional 5.5% |
| Immigrants | Belarus | 99.2 /100 | #51 | Exceptional 5.5% |
| Swedes | 99.1 /100 | #52 | Exceptional 5.5% |
| Immigrants | Russia | 99.1 /100 | #53 | Exceptional 5.5% |
| Immigrants | Lebanon | 99.1 /100 | #54 | Exceptional 5.5% |
| Immigrants | Denmark | 99.1 /100 | #55 | Exceptional 5.5% |
| Immigrants | Romania | 99.0 /100 | #56 | Exceptional 5.5% |