Senegalese vs Mexican Single Father Poverty

COMPARE

Senegalese
Race
Ancestry
AfghanAfricanAlaska NativeAlaskan AthabascanAlbanianAleutAlsatianAmericanApacheArabArapahoArgentineanArmenianAssyrian/Chaldean/SyriacAustralianAustrianBahamianBangladeshiBarbadianBasqueBelgianBelizeanBermudanBhutaneseBlackfeetBolivianBrazilianBritishBritish West IndianBulgarianBurmeseCajunCambodianCanadianCape VerdeanCarpatho RusynCelticCentral AmericanCentral American IndianCherokeeCheyenneChickasawChileanChineseChippewaChoctawColombianColvilleComancheCosta RicanCreeCreekCroatianCrowCubanCypriotCzechCzechoslovakianDanishDelawareDominicanDutchDutch West IndianEastern EuropeanEcuadorianEgyptianEnglishEstonianEthiopianEuropeanFijianFilipinoFinnishFrenchFrench American IndianFrench CanadianGermanGerman RussianGhanaianGreekGuamanian/ChamorroGuatemalanGuyaneseHaitianHmongHonduranHopiHoumaHungarianIcelanderIndian (Asian)IndonesianInupiatIranianIraqiIrishIroquoisIsraeliItalianJamaicanJapaneseJordanianKenyanKiowaKoreanLaotianLatvianLebaneseLiberianLithuanianLumbeeLuxembourgerMacedonianMalaysianMalteseMarshalleseMenomineeMexican American IndianMongolianMoroccanNative HawaiianNavajoNepaleseNew ZealanderNicaraguanNigerianNorthern EuropeanNorwegianOkinawanOsageOttawaPaiutePakistaniPalestinianPanamanianParaguayanPennsylvania GermanPeruvianPimaPolishPortuguesePotawatomiPuebloPuerto RicanPuget Sound SalishRomanianRussianSalvadoranSamoanScandinavianScotch-IrishScottishSeminoleSenegaleseSerbianShoshoneSierra LeoneanSiouxSlavicSlovakSloveneSomaliSouth AfricanSouth AmericanSouth American IndianSoviet UnionSpaniardSpanishSpanish AmericanSpanish American IndianSri LankanSubsaharan AfricanSudaneseSwedishSwissSyrianTaiwaneseThaiTlingit-HaidaTohono O'OdhamTonganTrinidadian and TobagonianTsimshianTurkishU.S. Virgin IslanderUgandanUkrainianUruguayanUteVenezuelanVietnameseWelshWest IndianYakamaYaquiYugoslavianYumanYup'ikZimbabwean
Immigration
NonimmigrantsImmigrantsAfghanistanAfricaAlbaniaArgentinaArmeniaAsiaAustraliaAustriaBahamasBangladeshBarbadosBelarusBelgiumBelizeBoliviaBosnia and HerzegovinaBrazilBulgariaBurma/MyanmarCabo VerdeCambodiaCameroonCanadaCaribbeanCentral AmericaChileChinaColombiaCongoCosta RicaCroatiaCubaCzechoslovakiaDenmarkDominicaDominican RepublicEastern AfricaEastern AsiaEastern EuropeEcuadorEgyptEl SalvadorEnglandEritreaEthiopiaEuropeFijiFranceGermanyGhanaGreeceGrenadaGuatemalaGuyanaHaitiHondurasHong KongHungaryIndiaIndonesiaIranIraqIrelandIsraelItalyJamaicaJapanJordanKazakhstanKenyaKoreaKuwaitLaosLatin AmericaLatviaLebanonLiberiaLithuaniaMalaysiaMexicoMicronesiaMiddle AfricaMoldovaMoroccoNepalNetherlandsNicaraguaNigeriaNorth AmericaNorth MacedoniaNorthern AfricaNorthern EuropeNorwayOceaniaPakistanPanamaPeruPhilippinesPolandPortugalRomaniaRussiaSaudi ArabiaScotlandSenegalSerbiaSierra LeoneSingaporeSomaliaSouth AfricaSouth AmericaSouth Central AsiaSouth Eastern AsiaSouthern EuropeSpainSri LankaSt. Vincent and the GrenadinesSudanSwedenSwitzerlandSyriaTaiwanThailandTrinidad and TobagoTurkeyUgandaUkraineUruguayUzbekistanVenezuelaVietnamWest IndiesWestern AfricaWestern AsiaWestern EuropeYemenZaireZimbabweAzores
Mexican
Race
Ancestry
AfghanAfricanAlaska NativeAlaskan AthabascanAlbanianAleutAlsatianAmericanApacheArabArapahoArgentineanArmenianAssyrian/Chaldean/SyriacAustralianAustrianBahamianBangladeshiBarbadianBasqueBelgianBelizeanBermudanBhutaneseBlackfeetBolivianBrazilianBritishBritish West IndianBulgarianBurmeseCajunCambodianCanadianCape VerdeanCarpatho RusynCelticCentral AmericanCentral American IndianCherokeeCheyenneChickasawChileanChineseChippewaChoctawColombianColvilleComancheCosta RicanCreeCreekCroatianCrowCubanCypriotCzechCzechoslovakianDanishDelawareDominicanDutchDutch West IndianEastern EuropeanEcuadorianEgyptianEnglishEstonianEthiopianEuropeanFijianFilipinoFinnishFrenchFrench American IndianFrench CanadianGermanGerman RussianGhanaianGreekGuamanian/ChamorroGuatemalanGuyaneseHaitianHmongHonduranHopiHoumaHungarianIcelanderIndian (Asian)IndonesianInupiatIranianIraqiIrishIroquoisIsraeliItalianJamaicanJapaneseJordanianKenyanKiowaKoreanLaotianLatvianLebaneseLiberianLithuanianLumbeeLuxembourgerMacedonianMalaysianMalteseMarshalleseMenomineeMexicanMexican American IndianMongolianMoroccanNative HawaiianNavajoNepaleseNew ZealanderNicaraguanNigerianNorthern EuropeanNorwegianOkinawanOsageOttawaPaiutePakistaniPalestinianPanamanianParaguayanPennsylvania GermanPeruvianPimaPolishPortuguesePotawatomiPuebloPuerto RicanPuget Sound SalishRomanianRussianSalvadoranSamoanScandinavianScotch-IrishScottishSeminoleSerbianShoshoneSierra LeoneanSiouxSlavicSlovakSloveneSomaliSouth AfricanSouth AmericanSouth American IndianSoviet UnionSpaniardSpanishSpanish AmericanSpanish American IndianSri LankanSubsaharan AfricanSudaneseSwedishSwissSyrianTaiwaneseThaiTlingit-HaidaTohono O'OdhamTonganTrinidadian and TobagonianTsimshianTurkishU.S. Virgin IslanderUgandanUkrainianUruguayanUteVenezuelanVietnameseWelshWest IndianYakamaYaquiYugoslavianYumanYup'ikZimbabwean
Immigration
NonimmigrantsImmigrantsAfghanistanAfricaAlbaniaArgentinaArmeniaAsiaAustraliaAustriaBahamasBangladeshBarbadosBelarusBelgiumBelizeBoliviaBosnia and HerzegovinaBrazilBulgariaBurma/MyanmarCabo VerdeCambodiaCameroonCanadaCaribbeanCentral AmericaChileChinaColombiaCongoCosta RicaCroatiaCubaCzechoslovakiaDenmarkDominicaDominican RepublicEastern AfricaEastern AsiaEastern EuropeEcuadorEgyptEl SalvadorEnglandEritreaEthiopiaEuropeFijiFranceGermanyGhanaGreeceGrenadaGuatemalaGuyanaHaitiHondurasHong KongHungaryIndiaIndonesiaIranIraqIrelandIsraelItalyJamaicaJapanJordanKazakhstanKenyaKoreaKuwaitLaosLatin AmericaLatviaLebanonLiberiaLithuaniaMalaysiaMexicoMicronesiaMiddle AfricaMoldovaMoroccoNepalNetherlandsNicaraguaNigeriaNorth AmericaNorth MacedoniaNorthern AfricaNorthern EuropeNorwayOceaniaPakistanPanamaPeruPhilippinesPolandPortugalRomaniaRussiaSaudi ArabiaScotlandSenegalSerbiaSierra LeoneSingaporeSomaliaSouth AfricaSouth AmericaSouth Central AsiaSouth Eastern AsiaSouthern EuropeSpainSri LankaSt. Vincent and the GrenadinesSudanSwedenSwitzerlandSyriaTaiwanThailandTrinidad and TobagoTurkeyUgandaUkraineUruguayUzbekistanVenezuelaVietnamWest IndiesWestern AfricaWestern AsiaWestern EuropeYemenZaireZimbabweAzores
Single Father Poverty
Income
Poverty
Unemployment
Labor Participation
Family Structure
Vehicle Availability
Education Level
Disability

Single Father Poverty Comparison

Senegalese

Mexicans

Tragic
Good
16.9%
SINGLE FATHER POVERTY
3.2/ 100
METRIC RATING
233rd/ 347
METRIC RANK
16.1%
SINGLE FATHER POVERTY
70.1/ 100
METRIC RATING
154th/ 347
METRIC RANK

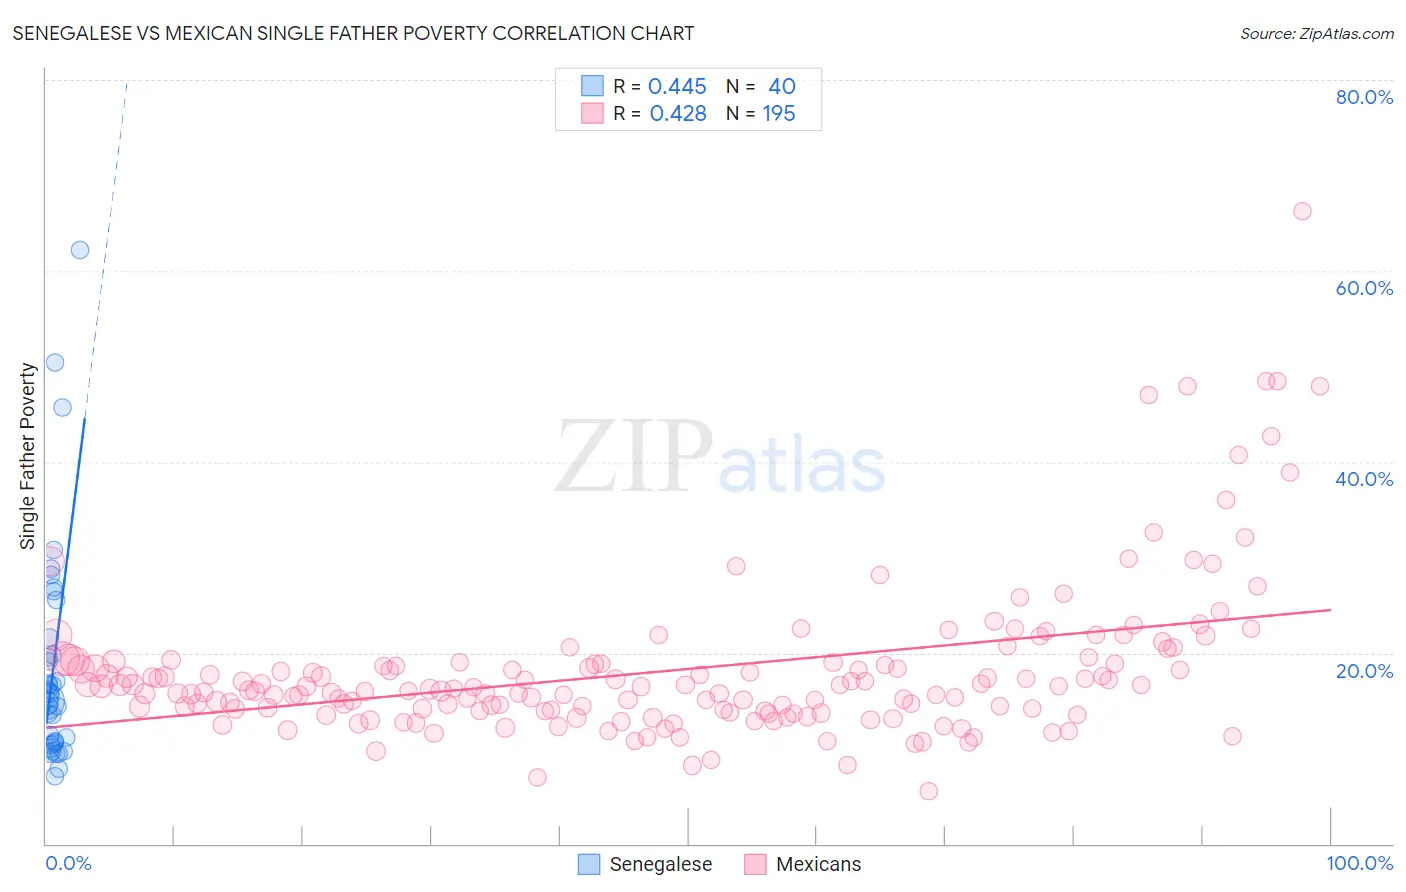
Senegalese vs Mexican Single Father Poverty Correlation Chart

The statistical analysis conducted on geographies consisting of 73,350,667 people shows a moderate positive correlation between the proportion of Senegalese and poverty level among single fathers in the United States with a correlation coefficient (R) of 0.445 and weighted average of 16.9%. Similarly, the statistical analysis conducted on geographies consisting of 409,525,490 people shows a moderate positive correlation between the proportion of Mexicans and poverty level among single fathers in the United States with a correlation coefficient (R) of 0.428 and weighted average of 16.1%, a difference of 4.8%.
Senegalese vs Mexican Single Father Poverty

Single Father Poverty Correlation Summary

MeasurementSenegaleseMexican
Minimum7.1%5.5%
Maximum62.2%66.2%
Range55.1%60.7%
Mean18.6%18.2%
Median15.2%16.2%
Interquartile 25% (IQ1)10.5%13.9%
Interquartile 75% (IQ3)20.7%19.0%
Interquartile Range (IQR)10.1%5.1%
Standard Deviation (Sample)11.8%8.2%
Standard Deviation (Population)11.7%8.1%

Similar Demographics by Single Father Poverty

Demographics Similar to Senegalese by Single Father Poverty

In terms of single father poverty, the demographic groups most similar to Senegalese are Marshallese (16.9%, a difference of 0.030%), Immigrants from Western Europe (16.9%, a difference of 0.12%), Immigrants from Germany (16.9%, a difference of 0.12%), Subsaharan African (16.9%, a difference of 0.13%), and Immigrants from Grenada (16.9%, a difference of 0.14%).
DemographicsRating | RankSingle Father Poverty
Hispanics or Latinos
6.1
/100
|
#226
Tragic
16.8%
British
5.6
/100
|
#227
Tragic
16.8%
Belgians
5.3
/100
|
#228
Tragic
16.8%
Israelis
4.6
/100
|
#229
Tragic
16.8%
Immigrants | Trinidad and Tobago
4.5
/100
|
#230
Tragic
16.8%
Spanish Americans
3.7
/100
|
#231
Tragic
16.9%
Immigrants | Grenada
3.7
/100
|
#232
Tragic
16.9%
Senegalese
3.2
/100
|
#233
Tragic
16.9%
Marshallese
3.1
/100
|
#234
Tragic
16.9%
Immigrants | Western Europe
2.9
/100
|
#235
Tragic
16.9%
Immigrants | Germany
2.9
/100
|
#236
Tragic
16.9%
Sub-Saharan Africans
2.9
/100
|
#237
Tragic
16.9%
Immigrants | Saudi Arabia
2.7
/100
|
#238
Tragic
16.9%
Bermudans
2.6
/100
|
#239
Tragic
16.9%
Finns
2.6
/100
|
#240
Tragic
16.9%

Demographics Similar to Mexicans by Single Father Poverty

In terms of single father poverty, the demographic groups most similar to Mexicans are Immigrants from Zimbabwe (16.1%, a difference of 0.10%), Immigrants from Israel (16.1%, a difference of 0.10%), Immigrants from Nicaragua (16.2%, a difference of 0.12%), Immigrants from France (16.1%, a difference of 0.16%), and Immigrants from Jordan (16.2%, a difference of 0.21%).
DemographicsRating | RankSingle Father Poverty
Colombians
77.1
/100
|
#147
Good
16.1%
Nigerians
76.8
/100
|
#148
Good
16.1%
South Africans
75.1
/100
|
#149
Good
16.1%
Jordanians
74.2
/100
|
#150
Good
16.1%
Immigrants | France
73.1
/100
|
#151
Good
16.1%
Immigrants | Zimbabwe
72.1
/100
|
#152
Good
16.1%
Immigrants | Israel
72.0
/100
|
#153
Good
16.1%
Mexicans
70.1
/100
|
#154
Good
16.1%
Immigrants | Nicaragua
67.8
/100
|
#155
Good
16.2%
Immigrants | Jordan
66.0
/100
|
#156
Good
16.2%
Immigrants | Czechoslovakia
62.8
/100
|
#157
Good
16.2%
Portuguese
62.3
/100
|
#158
Good
16.2%
Belizeans
59.9
/100
|
#159
Average
16.2%
Immigrants | Sudan
59.8
/100
|
#160
Average
16.2%
Estonians
56.7
/100
|
#161
Average
16.2%