Argentinean vs Osage Single Mother Poverty
COMPARE
Argentinean
Osage
Single Mother Poverty
Single Mother Poverty Comparison
Argentineans
Osage
27.2%
SINGLE MOTHER POVERTY
99.6/ 100
METRIC RATING
58th/ 347
METRIC RANK
32.6%
SINGLE MOTHER POVERTY
0.0/ 100
METRIC RATING
290th/ 347
METRIC RANK
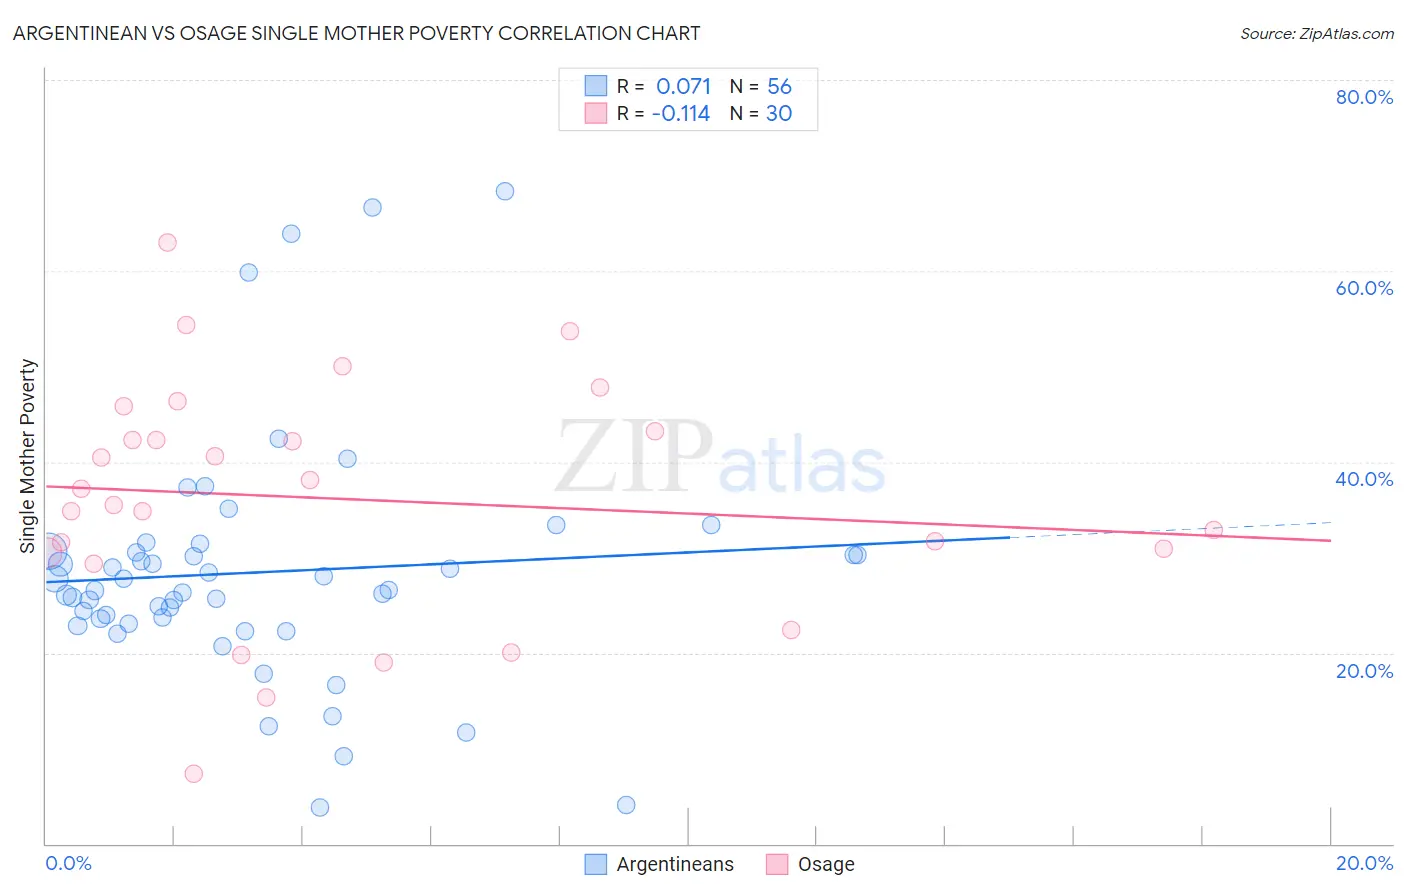
Argentinean vs Osage Single Mother Poverty Correlation Chart
The statistical analysis conducted on geographies consisting of 291,528,298 people shows a slight positive correlation between the proportion of Argentineans and poverty level among single mothers in the United States with a correlation coefficient (R) of 0.071 and weighted average of 27.2%. Similarly, the statistical analysis conducted on geographies consisting of 91,278,807 people shows a poor negative correlation between the proportion of Osage and poverty level among single mothers in the United States with a correlation coefficient (R) of -0.114 and weighted average of 32.6%, a difference of 19.9%.
Single Mother Poverty Correlation Summary
| Measurement | Argentinean | Osage |
| Minimum | 3.7% | 7.3% |
| Maximum | 68.3% | 63.0% |
| Range | 64.6% | 55.7% |
| Mean | 28.4% | 36.1% |
| Median | 26.5% | 36.3% |
| Interquartile 25% (IQ1) | 23.3% | 30.5% |
| Interquartile 75% (IQ3) | 30.6% | 43.2% |
| Interquartile Range (IQR) | 7.3% | 12.7% |
| Standard Deviation (Sample) | 12.7% | 12.5% |
| Standard Deviation (Population) | 12.6% | 12.3% |
Similar Demographics by Single Mother Poverty
Demographics Similar to Argentineans by Single Mother Poverty
In terms of single mother poverty, the demographic groups most similar to Argentineans are Paraguayan (27.2%, a difference of 0.010%), Eastern European (27.2%, a difference of 0.050%), Palestinian (27.2%, a difference of 0.15%), Immigrants from Eastern Europe (27.2%, a difference of 0.16%), and Immigrants from Romania (27.2%, a difference of 0.18%).
| Demographics | Rating | Rank | Single Mother Poverty |
| Immigrants | Argentina | 99.7 /100 | #51 | Exceptional 27.1% |
| Immigrants | South Eastern Asia | 99.7 /100 | #52 | Exceptional 27.1% |
| Immigrants | Jordan | 99.7 /100 | #53 | Exceptional 27.1% |
| Immigrants | Bulgaria | 99.7 /100 | #54 | Exceptional 27.1% |
| Immigrants | Egypt | 99.7 /100 | #55 | Exceptional 27.1% |
| Immigrants | Romania | 99.7 /100 | #56 | Exceptional 27.2% |
| Palestinians | 99.7 /100 | #57 | Exceptional 27.2% |
| Argentineans | 99.6 /100 | #58 | Exceptional 27.2% |
| Paraguayans | 99.6 /100 | #59 | Exceptional 27.2% |
| Eastern Europeans | 99.6 /100 | #60 | Exceptional 27.2% |
| Immigrants | Eastern Europe | 99.6 /100 | #61 | Exceptional 27.2% |
| Immigrants | Malaysia | 99.5 /100 | #62 | Exceptional 27.3% |
| Immigrants | Northern Europe | 99.5 /100 | #63 | Exceptional 27.3% |
| Russians | 99.5 /100 | #64 | Exceptional 27.3% |
| Immigrants | Turkey | 99.5 /100 | #65 | Exceptional 27.3% |
Demographics Similar to Osage by Single Mother Poverty
In terms of single mother poverty, the demographic groups most similar to Osage are U.S. Virgin Islander (32.6%, a difference of 0.11%), Somali (32.6%, a difference of 0.14%), Immigrants from Dominica (32.5%, a difference of 0.37%), Yup'ik (32.5%, a difference of 0.49%), and Immigrants from Latin America (32.4%, a difference of 0.57%).
| Demographics | Rating | Rank | Single Mother Poverty |
| Spanish Americans | 0.0 /100 | #283 | Tragic 32.3% |
| Indonesians | 0.0 /100 | #284 | Tragic 32.4% |
| Immigrants | Latin America | 0.0 /100 | #285 | Tragic 32.4% |
| Yup'ik | 0.0 /100 | #286 | Tragic 32.5% |
| Immigrants | Dominica | 0.0 /100 | #287 | Tragic 32.5% |
| Somalis | 0.0 /100 | #288 | Tragic 32.6% |
| U.S. Virgin Islanders | 0.0 /100 | #289 | Tragic 32.6% |
| Osage | 0.0 /100 | #290 | Tragic 32.6% |
| Guatemalans | 0.0 /100 | #291 | Tragic 32.9% |
| Shoshone | 0.0 /100 | #292 | Tragic 32.9% |
| Aleuts | 0.0 /100 | #293 | Tragic 32.9% |
| French American Indians | 0.0 /100 | #294 | Tragic 33.1% |
| Yaqui | 0.0 /100 | #295 | Tragic 33.1% |
| Blackfeet | 0.0 /100 | #296 | Tragic 33.2% |
| Pennsylvania Germans | 0.0 /100 | #297 | Tragic 33.2% |