Belizean vs Osage Single Mother Poverty
COMPARE
Belizean
Osage
Single Mother Poverty
Single Mother Poverty Comparison
Belizeans
Osage
31.0%
SINGLE MOTHER POVERTY
0.5/ 100
METRIC RATING
255th/ 347
METRIC RANK
32.6%
SINGLE MOTHER POVERTY
0.0/ 100
METRIC RATING
290th/ 347
METRIC RANK
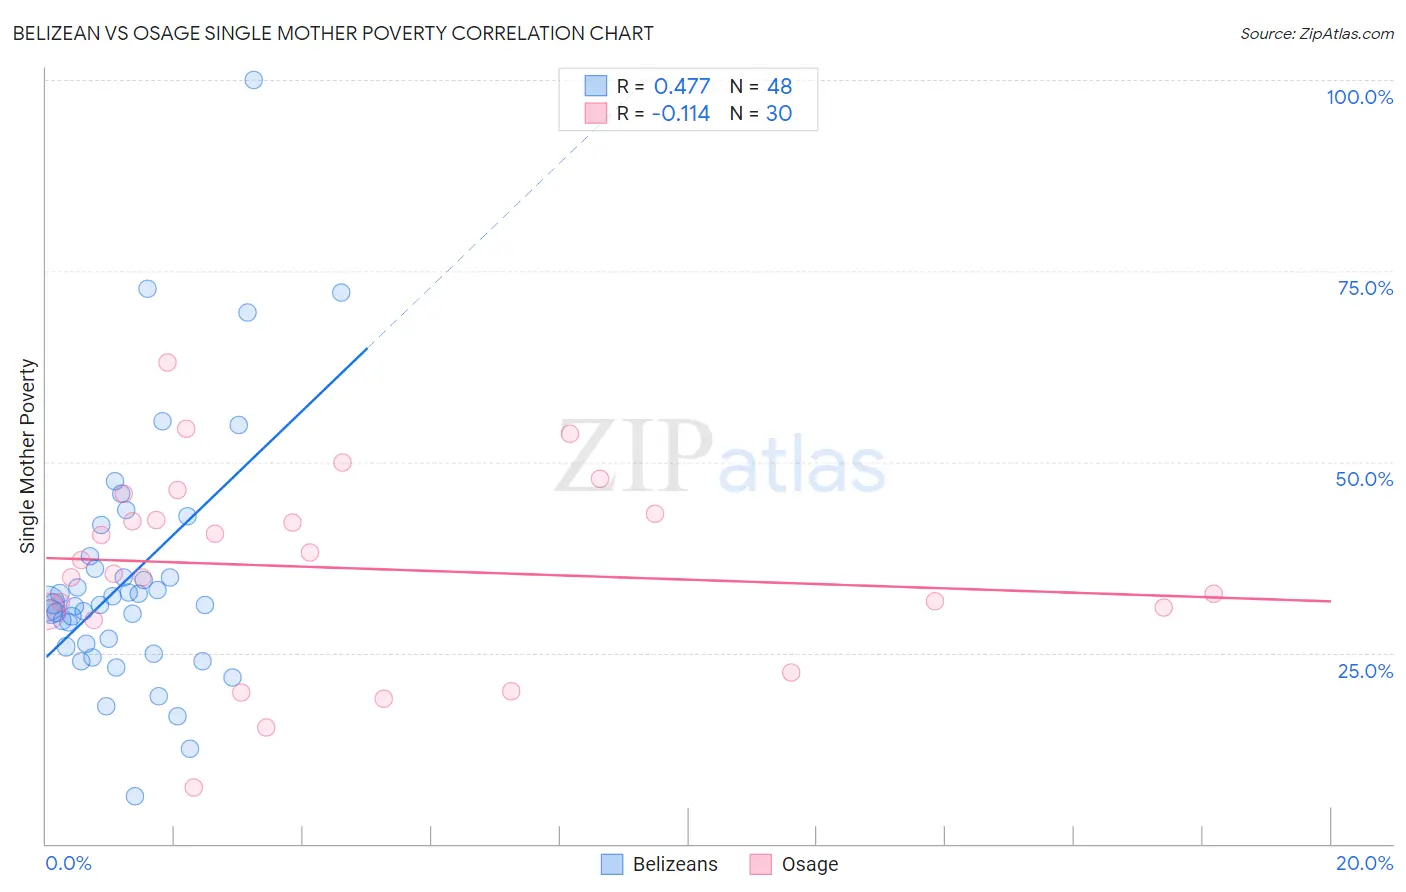
Belizean vs Osage Single Mother Poverty Correlation Chart
The statistical analysis conducted on geographies consisting of 143,389,155 people shows a moderate positive correlation between the proportion of Belizeans and poverty level among single mothers in the United States with a correlation coefficient (R) of 0.477 and weighted average of 31.0%. Similarly, the statistical analysis conducted on geographies consisting of 91,278,807 people shows a poor negative correlation between the proportion of Osage and poverty level among single mothers in the United States with a correlation coefficient (R) of -0.114 and weighted average of 32.6%, a difference of 5.1%.
Single Mother Poverty Correlation Summary
| Measurement | Belizean | Osage |
| Minimum | 6.2% | 7.3% |
| Maximum | 100.0% | 63.0% |
| Range | 93.8% | 55.7% |
| Mean | 35.0% | 36.1% |
| Median | 31.4% | 36.3% |
| Interquartile 25% (IQ1) | 26.0% | 30.5% |
| Interquartile 75% (IQ3) | 36.8% | 43.2% |
| Interquartile Range (IQR) | 10.9% | 12.7% |
| Standard Deviation (Sample) | 16.6% | 12.5% |
| Standard Deviation (Population) | 16.5% | 12.3% |
Similar Demographics by Single Mother Poverty
Demographics Similar to Belizeans by Single Mother Poverty
In terms of single mother poverty, the demographic groups most similar to Belizeans are Senegalese (31.0%, a difference of 0.11%), Immigrants from West Indies (31.1%, a difference of 0.21%), Celtic (30.9%, a difference of 0.25%), Immigrants from Bahamas (31.1%, a difference of 0.26%), and Alaska Native (30.9%, a difference of 0.28%).
| Demographics | Rating | Rank | Single Mother Poverty |
| French Canadians | 0.9 /100 | #248 | Tragic 30.8% |
| Cape Verdeans | 0.8 /100 | #249 | Tragic 30.8% |
| Vietnamese | 0.7 /100 | #250 | Tragic 30.9% |
| Tlingit-Haida | 0.6 /100 | #251 | Tragic 30.9% |
| Alaska Natives | 0.6 /100 | #252 | Tragic 30.9% |
| Celtics | 0.6 /100 | #253 | Tragic 30.9% |
| Senegalese | 0.5 /100 | #254 | Tragic 31.0% |
| Belizeans | 0.5 /100 | #255 | Tragic 31.0% |
| Immigrants | West Indies | 0.4 /100 | #256 | Tragic 31.1% |
| Immigrants | Bahamas | 0.4 /100 | #257 | Tragic 31.1% |
| Immigrants | Caribbean | 0.4 /100 | #258 | Tragic 31.1% |
| Immigrants | Bangladesh | 0.4 /100 | #259 | Tragic 31.1% |
| Whites/Caucasians | 0.3 /100 | #260 | Tragic 31.2% |
| Immigrants | El Salvador | 0.3 /100 | #261 | Tragic 31.2% |
| Hmong | 0.3 /100 | #262 | Tragic 31.2% |
Demographics Similar to Osage by Single Mother Poverty
In terms of single mother poverty, the demographic groups most similar to Osage are U.S. Virgin Islander (32.6%, a difference of 0.11%), Somali (32.6%, a difference of 0.14%), Immigrants from Dominica (32.5%, a difference of 0.37%), Yup'ik (32.5%, a difference of 0.49%), and Immigrants from Latin America (32.4%, a difference of 0.57%).
| Demographics | Rating | Rank | Single Mother Poverty |
| Spanish Americans | 0.0 /100 | #283 | Tragic 32.3% |
| Indonesians | 0.0 /100 | #284 | Tragic 32.4% |
| Immigrants | Latin America | 0.0 /100 | #285 | Tragic 32.4% |
| Yup'ik | 0.0 /100 | #286 | Tragic 32.5% |
| Immigrants | Dominica | 0.0 /100 | #287 | Tragic 32.5% |
| Somalis | 0.0 /100 | #288 | Tragic 32.6% |
| U.S. Virgin Islanders | 0.0 /100 | #289 | Tragic 32.6% |
| Osage | 0.0 /100 | #290 | Tragic 32.6% |
| Guatemalans | 0.0 /100 | #291 | Tragic 32.9% |
| Shoshone | 0.0 /100 | #292 | Tragic 32.9% |
| Aleuts | 0.0 /100 | #293 | Tragic 32.9% |
| French American Indians | 0.0 /100 | #294 | Tragic 33.1% |
| Yaqui | 0.0 /100 | #295 | Tragic 33.1% |
| Blackfeet | 0.0 /100 | #296 | Tragic 33.2% |
| Pennsylvania Germans | 0.0 /100 | #297 | Tragic 33.2% |