Nonimmigrants vs Japanese Receiving Food Stamps
COMPARE
Nonimmigrants
Japanese
Receiving Food Stamps
Receiving Food Stamps Comparison
Nonimmigrants
Japanese
12.4%
RECEIVING FOOD STAMPS
17.6/ 100
METRIC RATING
204th/ 347
METRIC RANK
14.1%
RECEIVING FOOD STAMPS
0.3/ 100
METRIC RATING
256th/ 347
METRIC RANK
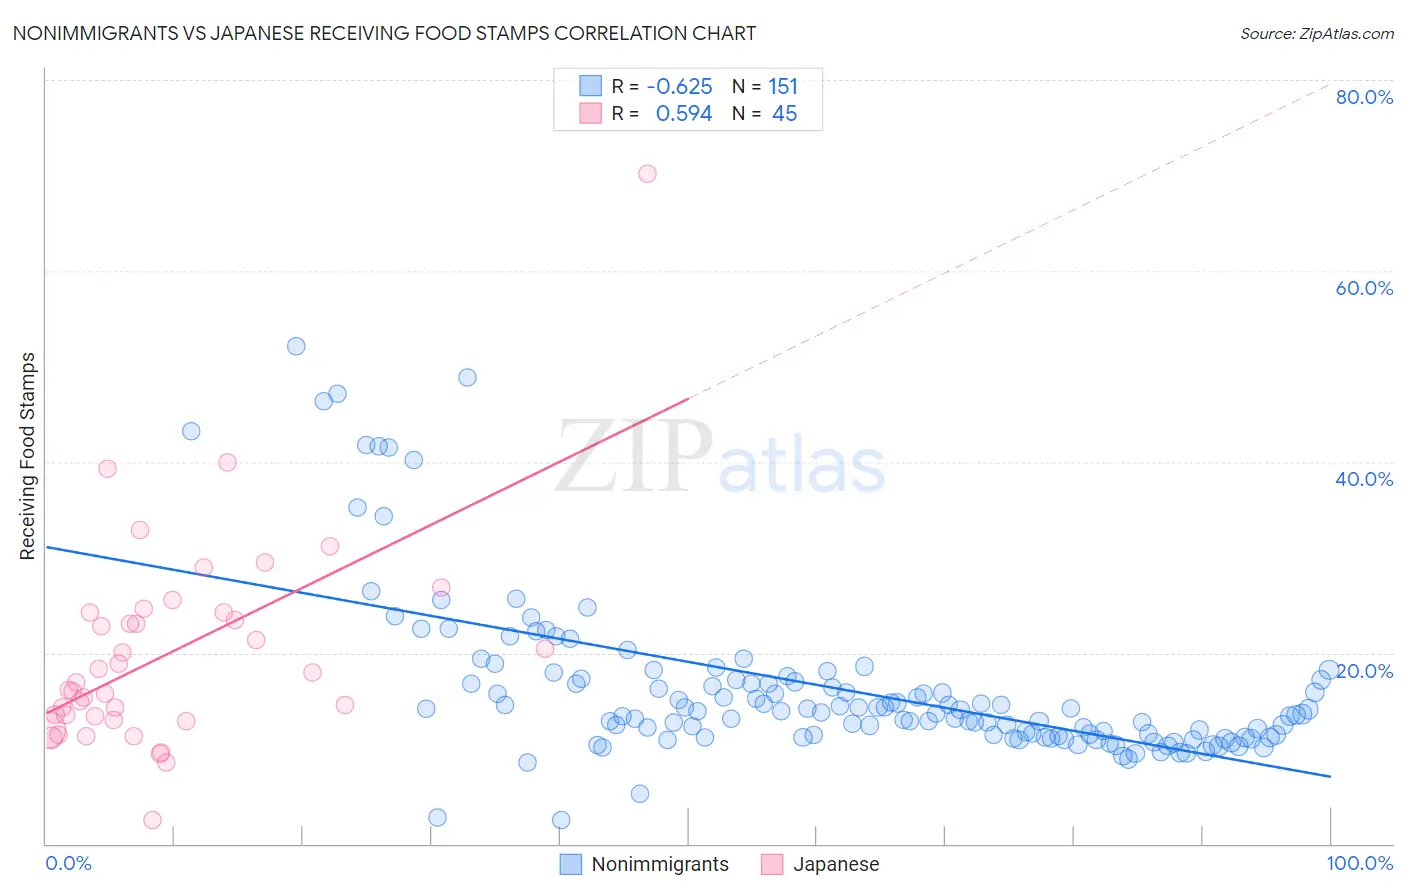
Nonimmigrants vs Japanese Receiving Food Stamps Correlation Chart
The statistical analysis conducted on geographies consisting of 580,622,931 people shows a significant negative correlation between the proportion of Nonimmigrants and percentage of population receiving government assistance and/or food stamps in the United States with a correlation coefficient (R) of -0.625 and weighted average of 12.4%. Similarly, the statistical analysis conducted on geographies consisting of 248,870,971 people shows a substantial positive correlation between the proportion of Japanese and percentage of population receiving government assistance and/or food stamps in the United States with a correlation coefficient (R) of 0.594 and weighted average of 14.1%, a difference of 13.9%.
Receiving Food Stamps Correlation Summary
| Measurement | Nonimmigrants | Japanese |
| Minimum | 2.4% | 2.5% |
| Maximum | 52.1% | 70.2% |
| Range | 49.7% | 67.7% |
| Mean | 16.2% | 19.9% |
| Median | 13.8% | 16.8% |
| Interquartile 25% (IQ1) | 11.2% | 13.1% |
| Interquartile 75% (IQ3) | 17.1% | 24.2% |
| Interquartile Range (IQR) | 5.9% | 11.1% |
| Standard Deviation (Sample) | 8.7% | 11.1% |
| Standard Deviation (Population) | 8.6% | 10.9% |
Similar Demographics by Receiving Food Stamps
Demographics Similar to Nonimmigrants by Receiving Food Stamps
In terms of receiving food stamps, the demographic groups most similar to Nonimmigrants are Shoshone (12.4%, a difference of 0.030%), Aleut (12.4%, a difference of 0.070%), Immigrants from Thailand (12.4%, a difference of 0.13%), South American (12.4%, a difference of 0.39%), and Immigrants from Venezuela (12.3%, a difference of 0.56%).
| Demographics | Rating | Rank | Receiving Food Stamps |
| Delaware | 26.1 /100 | #197 | Fair 12.2% |
| Immigrants | Costa Rica | 25.4 /100 | #198 | Fair 12.2% |
| Portuguese | 25.1 /100 | #199 | Fair 12.2% |
| Sierra Leoneans | 23.6 /100 | #200 | Fair 12.2% |
| Ugandans | 22.5 /100 | #201 | Fair 12.2% |
| Immigrants | Venezuela | 20.1 /100 | #202 | Fair 12.3% |
| Shoshone | 17.7 /100 | #203 | Poor 12.4% |
| Immigrants | Nonimmigrants | 17.6 /100 | #204 | Poor 12.4% |
| Aleuts | 17.3 /100 | #205 | Poor 12.4% |
| Immigrants | Thailand | 17.0 /100 | #206 | Poor 12.4% |
| South Americans | 16.0 /100 | #207 | Poor 12.4% |
| Potawatomi | 14.6 /100 | #208 | Poor 12.5% |
| Immigrants | Sierra Leone | 12.9 /100 | #209 | Poor 12.5% |
| Immigrants | Uruguay | 12.8 /100 | #210 | Poor 12.5% |
| Colombians | 10.2 /100 | #211 | Poor 12.6% |
Demographics Similar to Japanese by Receiving Food Stamps
In terms of receiving food stamps, the demographic groups most similar to Japanese are Subsaharan African (14.1%, a difference of 0.020%), Marshallese (14.1%, a difference of 0.030%), Arapaho (14.1%, a difference of 0.10%), Immigrants from Ghana (14.1%, a difference of 0.18%), and Creek (14.1%, a difference of 0.30%).
| Demographics | Rating | Rank | Receiving Food Stamps |
| Indonesians | 0.6 /100 | #249 | Tragic 13.9% |
| Immigrants | Cambodia | 0.5 /100 | #250 | Tragic 13.9% |
| Yaqui | 0.5 /100 | #251 | Tragic 13.9% |
| Ghanaians | 0.5 /100 | #252 | Tragic 14.0% |
| Spanish Americans | 0.4 /100 | #253 | Tragic 14.0% |
| Marshallese | 0.3 /100 | #254 | Tragic 14.1% |
| Sub-Saharan Africans | 0.3 /100 | #255 | Tragic 14.1% |
| Japanese | 0.3 /100 | #256 | Tragic 14.1% |
| Arapaho | 0.3 /100 | #257 | Tragic 14.1% |
| Immigrants | Ghana | 0.3 /100 | #258 | Tragic 14.1% |
| Creek | 0.3 /100 | #259 | Tragic 14.1% |
| Central Americans | 0.3 /100 | #260 | Tragic 14.1% |
| Immigrants | Congo | 0.3 /100 | #261 | Tragic 14.1% |
| Paiute | 0.2 /100 | #262 | Tragic 14.3% |
| Immigrants | Portugal | 0.2 /100 | #263 | Tragic 14.3% |