Scotch-Irish vs Immigrants from Haiti In Labor Force | Age > 16
COMPARE
Scotch-Irish
Immigrants from Haiti
In Labor Force | Age > 16
In Labor Force | Age > 16 Comparison
Scotch-Irish
Immigrants from Haiti
63.3%
IN LABOR FORCE | AGE > 16
0.0/ 100
METRIC RATING
309th/ 347
METRIC RANK
65.1%
IN LABOR FORCE | AGE > 16
43.3/ 100
METRIC RATING
179th/ 347
METRIC RANK
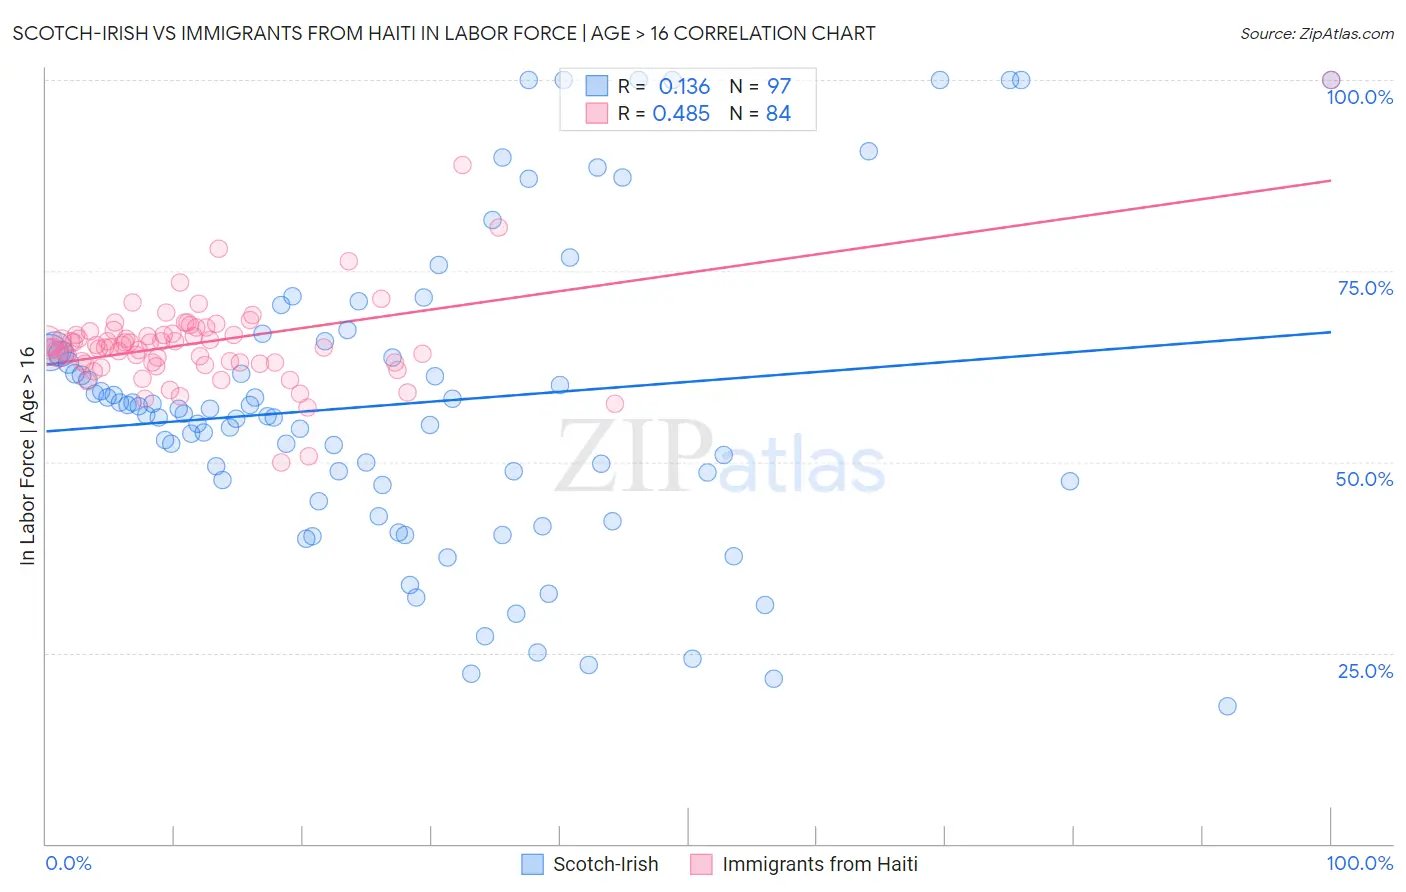
Scotch-Irish vs Immigrants from Haiti In Labor Force | Age > 16 Correlation Chart
The statistical analysis conducted on geographies consisting of 548,771,669 people shows a poor positive correlation between the proportion of Scotch-Irish and labor force participation rate among population ages 16 and over in the United States with a correlation coefficient (R) of 0.136 and weighted average of 63.3%. Similarly, the statistical analysis conducted on geographies consisting of 225,285,976 people shows a moderate positive correlation between the proportion of Immigrants from Haiti and labor force participation rate among population ages 16 and over in the United States with a correlation coefficient (R) of 0.485 and weighted average of 65.1%, a difference of 2.8%.
In Labor Force | Age > 16 Correlation Summary
| Measurement | Scotch-Irish | Immigrants from Haiti |
| Minimum | 18.0% | 50.0% |
| Maximum | 100.0% | 100.0% |
| Range | 82.0% | 50.0% |
| Mean | 57.6% | 65.6% |
| Median | 56.2% | 65.1% |
| Interquartile 25% (IQ1) | 47.2% | 63.0% |
| Interquartile 75% (IQ3) | 64.5% | 66.9% |
| Interquartile Range (IQR) | 17.3% | 3.9% |
| Standard Deviation (Sample) | 19.8% | 6.5% |
| Standard Deviation (Population) | 19.7% | 6.5% |
Similar Demographics by In Labor Force | Age > 16
Demographics Similar to Scotch-Irish by In Labor Force | Age > 16
In terms of in labor force | age > 16, the demographic groups most similar to Scotch-Irish are Shoshone (63.2%, a difference of 0.070%), Blackfeet (63.2%, a difference of 0.080%), Pennsylvania German (63.4%, a difference of 0.13%), Iroquois (63.2%, a difference of 0.14%), and Central American Indian (63.4%, a difference of 0.17%).
| Demographics | Rating | Rank | In Labor Force | Age > 16 |
| Delaware | 0.0 /100 | #302 | Tragic 63.6% |
| Cree | 0.0 /100 | #303 | Tragic 63.5% |
| Immigrants | Nonimmigrants | 0.0 /100 | #304 | Tragic 63.5% |
| Osage | 0.0 /100 | #305 | Tragic 63.5% |
| Blacks/African Americans | 0.0 /100 | #306 | Tragic 63.4% |
| Central American Indians | 0.0 /100 | #307 | Tragic 63.4% |
| Pennsylvania Germans | 0.0 /100 | #308 | Tragic 63.4% |
| Scotch-Irish | 0.0 /100 | #309 | Tragic 63.3% |
| Shoshone | 0.0 /100 | #310 | Tragic 63.2% |
| Blackfeet | 0.0 /100 | #311 | Tragic 63.2% |
| Iroquois | 0.0 /100 | #312 | Tragic 63.2% |
| Chippewa | 0.0 /100 | #313 | Tragic 63.1% |
| Yaqui | 0.0 /100 | #314 | Tragic 63.0% |
| Potawatomi | 0.0 /100 | #315 | Tragic 62.8% |
| Yup'ik | 0.0 /100 | #316 | Tragic 62.7% |
Demographics Similar to Immigrants from Haiti by In Labor Force | Age > 16
In terms of in labor force | age > 16, the demographic groups most similar to Immigrants from Haiti are Immigrants from Latvia (65.1%, a difference of 0.0%), Immigrants from Panama (65.1%, a difference of 0.010%), Trinidadian and Tobagonian (65.1%, a difference of 0.020%), Eastern European (65.1%, a difference of 0.030%), and Immigrants from Nicaragua (65.1%, a difference of 0.030%).
| Demographics | Rating | Rank | In Labor Force | Age > 16 |
| Immigrants | Sweden | 61.3 /100 | #172 | Good 65.2% |
| Immigrants | Ukraine | 53.7 /100 | #173 | Average 65.1% |
| Macedonians | 50.0 /100 | #174 | Average 65.1% |
| Nicaraguans | 49.7 /100 | #175 | Average 65.1% |
| Swedes | 47.4 /100 | #176 | Average 65.1% |
| Eastern Europeans | 46.2 /100 | #177 | Average 65.1% |
| Trinidadians and Tobagonians | 45.2 /100 | #178 | Average 65.1% |
| Immigrants | Haiti | 43.3 /100 | #179 | Average 65.1% |
| Immigrants | Latvia | 42.9 /100 | #180 | Average 65.1% |
| Immigrants | Panama | 42.4 /100 | #181 | Average 65.1% |
| Immigrants | Nicaragua | 41.1 /100 | #182 | Average 65.1% |
| Soviet Union | 40.5 /100 | #183 | Average 65.0% |
| Carpatho Rusyns | 40.0 /100 | #184 | Average 65.0% |
| Syrians | 40.0 /100 | #185 | Average 65.0% |
| Immigrants | Switzerland | 38.2 /100 | #186 | Fair 65.0% |