Cheyenne vs Immigrants from Haiti Receiving Food Stamps
COMPARE
Cheyenne
Immigrants from Haiti
Receiving Food Stamps
Receiving Food Stamps Comparison
Cheyenne
Immigrants from Haiti
14.3%
RECEIVING FOOD STAMPS
0.2/ 100
METRIC RATING
266th/ 347
METRIC RANK
18.2%
RECEIVING FOOD STAMPS
0.0/ 100
METRIC RATING
325th/ 347
METRIC RANK
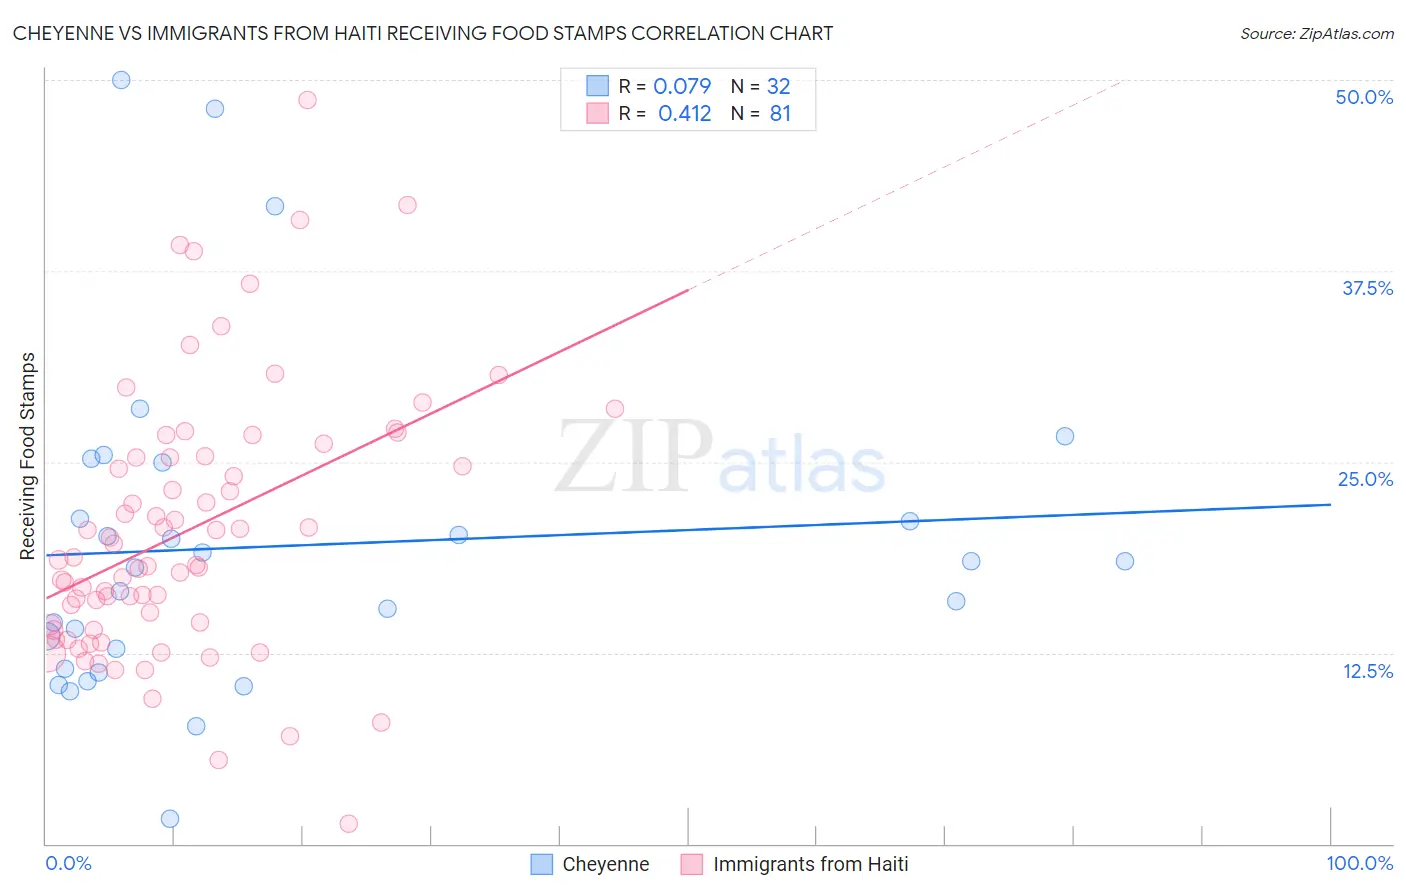
Cheyenne vs Immigrants from Haiti Receiving Food Stamps Correlation Chart
The statistical analysis conducted on geographies consisting of 80,695,470 people shows a slight positive correlation between the proportion of Cheyenne and percentage of population receiving government assistance and/or food stamps in the United States with a correlation coefficient (R) of 0.079 and weighted average of 14.3%. Similarly, the statistical analysis conducted on geographies consisting of 225,016,016 people shows a moderate positive correlation between the proportion of Immigrants from Haiti and percentage of population receiving government assistance and/or food stamps in the United States with a correlation coefficient (R) of 0.412 and weighted average of 18.2%, a difference of 27.4%.
Receiving Food Stamps Correlation Summary
| Measurement | Cheyenne | Immigrants from Haiti |
| Minimum | 1.6% | 1.3% |
| Maximum | 50.0% | 48.7% |
| Range | 48.4% | 47.4% |
| Mean | 19.5% | 20.5% |
| Median | 18.3% | 18.6% |
| Interquartile 25% (IQ1) | 12.1% | 14.2% |
| Interquartile 75% (IQ3) | 23.2% | 25.4% |
| Interquartile Range (IQR) | 11.0% | 11.2% |
| Standard Deviation (Sample) | 10.8% | 8.7% |
| Standard Deviation (Population) | 10.6% | 8.7% |
Similar Demographics by Receiving Food Stamps
Demographics Similar to Cheyenne by Receiving Food Stamps
In terms of receiving food stamps, the demographic groups most similar to Cheyenne are Blackfeet (14.3%, a difference of 0.080%), Immigrants from Uzbekistan (14.3%, a difference of 0.14%), Dutch West Indian (14.3%, a difference of 0.22%), Paiute (14.3%, a difference of 0.23%), and Immigrants from Portugal (14.3%, a difference of 0.23%).
| Demographics | Rating | Rank | Receiving Food Stamps |
| Creek | 0.3 /100 | #259 | Tragic 14.1% |
| Central Americans | 0.3 /100 | #260 | Tragic 14.1% |
| Immigrants | Congo | 0.3 /100 | #261 | Tragic 14.1% |
| Paiute | 0.2 /100 | #262 | Tragic 14.3% |
| Immigrants | Portugal | 0.2 /100 | #263 | Tragic 14.3% |
| Immigrants | Uzbekistan | 0.2 /100 | #264 | Tragic 14.3% |
| Blackfeet | 0.2 /100 | #265 | Tragic 14.3% |
| Cheyenne | 0.2 /100 | #266 | Tragic 14.3% |
| Dutch West Indians | 0.2 /100 | #267 | Tragic 14.3% |
| Guatemalans | 0.1 /100 | #268 | Tragic 14.4% |
| Nepalese | 0.1 /100 | #269 | Tragic 14.6% |
| Mexicans | 0.1 /100 | #270 | Tragic 14.6% |
| Immigrants | Guatemala | 0.1 /100 | #271 | Tragic 14.6% |
| Chippewa | 0.1 /100 | #272 | Tragic 14.7% |
| Alaskan Athabascans | 0.1 /100 | #273 | Tragic 14.7% |
Demographics Similar to Immigrants from Haiti by Receiving Food Stamps
In terms of receiving food stamps, the demographic groups most similar to Immigrants from Haiti are Cuban (18.2%, a difference of 0.11%), Apache (18.3%, a difference of 0.42%), Colville (18.3%, a difference of 0.63%), Immigrants from Dominica (18.4%, a difference of 1.1%), and British West Indian (17.9%, a difference of 1.8%).
| Demographics | Rating | Rank | Receiving Food Stamps |
| Menominee | 0.0 /100 | #318 | Tragic 17.2% |
| Immigrants | St. Vincent and the Grenadines | 0.0 /100 | #319 | Tragic 17.2% |
| Immigrants | Nicaragua | 0.0 /100 | #320 | Tragic 17.2% |
| Natives/Alaskans | 0.0 /100 | #321 | Tragic 17.3% |
| Immigrants | Grenada | 0.0 /100 | #322 | Tragic 17.8% |
| Haitians | 0.0 /100 | #323 | Tragic 17.8% |
| British West Indians | 0.0 /100 | #324 | Tragic 17.9% |
| Immigrants | Haiti | 0.0 /100 | #325 | Tragic 18.2% |
| Cubans | 0.0 /100 | #326 | Tragic 18.2% |
| Apache | 0.0 /100 | #327 | Tragic 18.3% |
| Colville | 0.0 /100 | #328 | Tragic 18.3% |
| Immigrants | Dominica | 0.0 /100 | #329 | Tragic 18.4% |
| Pima | 0.0 /100 | #330 | Tragic 19.0% |
| Immigrants | Caribbean | 0.0 /100 | #331 | Tragic 19.6% |
| Pueblo | 0.0 /100 | #332 | Tragic 19.9% |