Scotch-Irish vs Immigrants from the Azores Single Male Poverty

COMPARE

Scotch-Irish
Race
Ancestry
AfghanAfricanAlaska NativeAlaskan AthabascanAlbanianAleutAlsatianAmericanApacheArabArapahoArgentineanArmenianAssyrian/Chaldean/SyriacAustralianAustrianBahamianBangladeshiBarbadianBasqueBelgianBelizeanBermudanBhutaneseBlackfeetBolivianBrazilianBritishBritish West IndianBulgarianBurmeseCajunCambodianCanadianCape VerdeanCarpatho RusynCelticCentral AmericanCentral American IndianCherokeeCheyenneChickasawChileanChineseChippewaChoctawColombianColvilleComancheCosta RicanCreeCreekCroatianCrowCubanCypriotCzechCzechoslovakianDanishDelawareDominicanDutchDutch West IndianEastern EuropeanEcuadorianEgyptianEnglishEstonianEthiopianEuropeanFijianFilipinoFinnishFrenchFrench American IndianFrench CanadianGermanGerman RussianGhanaianGreekGuamanian/ChamorroGuatemalanGuyaneseHaitianHmongHonduranHopiHoumaHungarianIcelanderIndian (Asian)IndonesianInupiatIranianIraqiIrishIroquoisIsraeliItalianJamaicanJapaneseJordanianKenyanKiowaKoreanLaotianLatvianLebaneseLiberianLithuanianLumbeeLuxembourgerMacedonianMalaysianMalteseMarshalleseMenomineeMexicanMexican American IndianMongolianMoroccanNative HawaiianNavajoNepaleseNew ZealanderNicaraguanNigerianNorthern EuropeanNorwegianOkinawanOsageOttawaPaiutePakistaniPalestinianPanamanianParaguayanPennsylvania GermanPeruvianPimaPolishPortuguesePotawatomiPuebloPuerto RicanPuget Sound SalishRomanianRussianSalvadoranSamoanScandinavianScotch-IrishScottishSeminoleSenegaleseSerbianShoshoneSierra LeoneanSiouxSlavicSlovakSloveneSomaliSouth AfricanSouth AmericanSouth American IndianSoviet UnionSpaniardSpanishSpanish AmericanSpanish American IndianSri LankanSubsaharan AfricanSudaneseSwedishSwissSyrianTaiwaneseThaiTlingit-HaidaTohono O'OdhamTonganTrinidadian and TobagonianTsimshianTurkishU.S. Virgin IslanderUgandanUkrainianUruguayanUteVenezuelanVietnameseWelshWest IndianYakamaYaquiYugoslavianYumanYup'ikZimbabwean
Immigration
NonimmigrantsImmigrantsAfghanistanAfricaAlbaniaArgentinaArmeniaAsiaAustraliaAustriaBahamasBangladeshBarbadosBelarusBelgiumBelizeBoliviaBosnia and HerzegovinaBrazilBulgariaBurma/MyanmarCabo VerdeCambodiaCameroonCanadaCaribbeanCentral AmericaChileChinaColombiaCongoCosta RicaCroatiaCubaCzechoslovakiaDenmarkDominicaDominican RepublicEastern AfricaEastern AsiaEastern EuropeEcuadorEgyptEl SalvadorEnglandEritreaEthiopiaEuropeFijiFranceGermanyGhanaGreeceGrenadaGuatemalaGuyanaHaitiHondurasHong KongHungaryIndiaIndonesiaIranIraqIrelandIsraelItalyJamaicaJapanJordanKazakhstanKenyaKoreaKuwaitLaosLatin AmericaLatviaLebanonLiberiaLithuaniaMalaysiaMexicoMicronesiaMiddle AfricaMoldovaMoroccoNepalNetherlandsNicaraguaNigeriaNorth AmericaNorth MacedoniaNorthern AfricaNorthern EuropeNorwayOceaniaPakistanPanamaPeruPhilippinesPolandPortugalRomaniaRussiaSaudi ArabiaScotlandSenegalSerbiaSierra LeoneSingaporeSomaliaSouth AfricaSouth AmericaSouth Central AsiaSouth Eastern AsiaSouthern EuropeSpainSri LankaSt. Vincent and the GrenadinesSudanSwedenSwitzerlandSyriaTaiwanThailandTrinidad and TobagoTurkeyUgandaUkraineUruguayUzbekistanVenezuelaVietnamWest IndiesWestern AfricaWestern AsiaWestern EuropeYemenZaireZimbabwe
Immigrants from the Azores
Race
Ancestry
AfghanAfricanAlaska NativeAlaskan AthabascanAlbanianAleutAlsatianAmericanApacheArabArapahoArgentineanArmenianAssyrian/Chaldean/SyriacAustralianAustrianBahamianBangladeshiBarbadianBasqueBelgianBelizeanBermudanBhutaneseBlackfeetBolivianBrazilianBritishBritish West IndianBulgarianBurmeseCajunCambodianCanadianCape VerdeanCarpatho RusynCelticCentral AmericanCentral American IndianCherokeeCheyenneChickasawChileanChineseChippewaChoctawColombianColvilleComancheCosta RicanCreeCreekCroatianCrowCubanCypriotCzechCzechoslovakianDanishDelawareDominicanDutchDutch West IndianEastern EuropeanEcuadorianEgyptianEnglishEstonianEthiopianEuropeanFijianFilipinoFinnishFrenchFrench American IndianFrench CanadianGermanGerman RussianGhanaianGreekGuamanian/ChamorroGuatemalanGuyaneseHaitianHmongHonduranHopiHoumaHungarianIcelanderIndian (Asian)IndonesianInupiatIranianIraqiIrishIroquoisIsraeliItalianJamaicanJapaneseJordanianKenyanKiowaKoreanLaotianLatvianLebaneseLiberianLithuanianLumbeeLuxembourgerMacedonianMalaysianMalteseMarshalleseMenomineeMexicanMexican American IndianMongolianMoroccanNative HawaiianNavajoNepaleseNew ZealanderNicaraguanNigerianNorthern EuropeanNorwegianOkinawanOsageOttawaPaiutePakistaniPalestinianPanamanianParaguayanPennsylvania GermanPeruvianPimaPolishPortuguesePotawatomiPuebloPuerto RicanPuget Sound SalishRomanianRussianSalvadoranSamoanScandinavianScottishSeminoleSenegaleseSerbianShoshoneSierra LeoneanSiouxSlavicSlovakSloveneSomaliSouth AfricanSouth AmericanSouth American IndianSoviet UnionSpaniardSpanishSpanish AmericanSpanish American IndianSri LankanSubsaharan AfricanSudaneseSwedishSwissSyrianTaiwaneseThaiTlingit-HaidaTohono O'OdhamTonganTrinidadian and TobagonianTsimshianTurkishU.S. Virgin IslanderUgandanUkrainianUruguayanUteVenezuelanVietnameseWelshWest IndianYakamaYaquiYugoslavianYumanYup'ikZimbabwean
Immigration
NonimmigrantsImmigrantsAfghanistanAfricaAlbaniaArgentinaArmeniaAsiaAustraliaAustriaBahamasBangladeshBarbadosBelarusBelgiumBelizeBoliviaBosnia and HerzegovinaBrazilBulgariaBurma/MyanmarCabo VerdeCambodiaCameroonCanadaCaribbeanCentral AmericaChileChinaColombiaCongoCosta RicaCroatiaCubaCzechoslovakiaDenmarkDominicaDominican RepublicEastern AfricaEastern AsiaEastern EuropeEcuadorEgyptEl SalvadorEnglandEritreaEthiopiaEuropeFijiFranceGermanyGhanaGreeceGrenadaGuatemalaGuyanaHaitiHondurasHong KongHungaryIndiaIndonesiaIranIraqIrelandIsraelItalyJamaicaJapanJordanKazakhstanKenyaKoreaKuwaitLaosLatin AmericaLatviaLebanonLiberiaLithuaniaMalaysiaMexicoMicronesiaMiddle AfricaMoldovaMoroccoNepalNetherlandsNicaraguaNigeriaNorth AmericaNorth MacedoniaNorthern AfricaNorthern EuropeNorwayOceaniaPakistanPanamaPeruPhilippinesPolandPortugalRomaniaRussiaSaudi ArabiaScotlandSenegalSerbiaSierra LeoneSingaporeSomaliaSouth AfricaSouth AmericaSouth Central AsiaSouth Eastern AsiaSouthern EuropeSpainSri LankaSt. Vincent and the GrenadinesSudanSwedenSwitzerlandSyriaTaiwanThailandTrinidad and TobagoTurkeyUgandaUkraineUruguayUzbekistanVenezuelaVietnamWest IndiesWestern AfricaWestern AsiaWestern EuropeYemenZaireZimbabweAzores
Single Male Poverty
Income
Poverty
Unemployment
Labor Participation
Family Structure
Vehicle Availability
Education Level
Disability

Single Male Poverty Comparison

Scotch-Irish

Immigrants from the Azores

Tragic
Tragic
14.7%
SINGLE MALE POVERTY
0.0/ 100
METRIC RATING
295th/ 347
METRIC RANK
13.2%
SINGLE MALE POVERTY
9.3/ 100
METRIC RATING
223rd/ 347
METRIC RANK

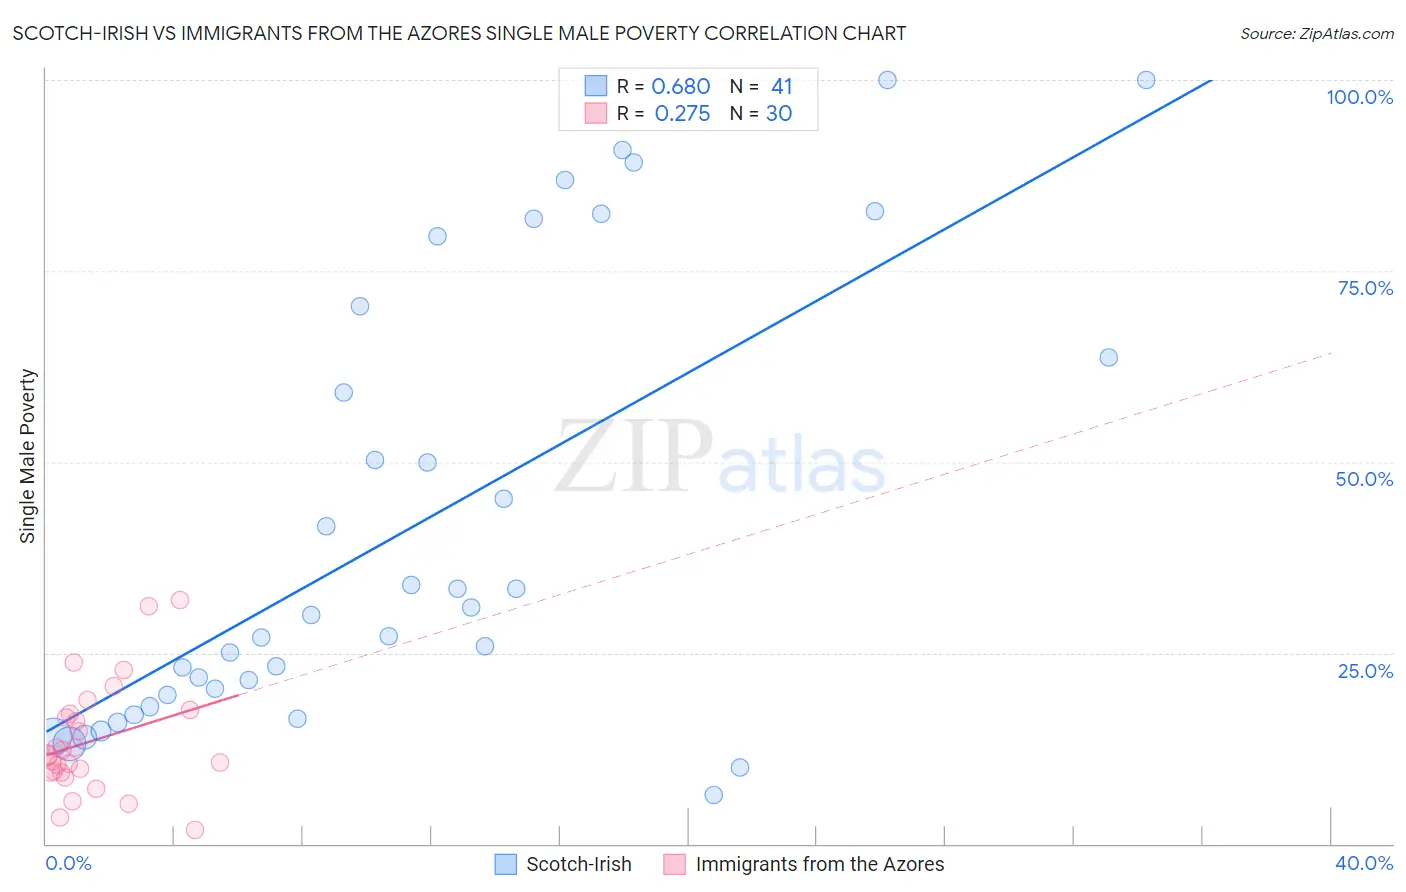
Scotch-Irish vs Immigrants from the Azores Single Male Poverty Correlation Chart

The statistical analysis conducted on geographies consisting of 456,240,238 people shows a significant positive correlation between the proportion of Scotch-Irish and poverty level among single males in the United States with a correlation coefficient (R) of 0.680 and weighted average of 14.7%. Similarly, the statistical analysis conducted on geographies consisting of 43,584,475 people shows a weak positive correlation between the proportion of Immigrants from the Azores and poverty level among single males in the United States with a correlation coefficient (R) of 0.275 and weighted average of 13.2%, a difference of 11.4%.
Scotch-Irish vs Immigrants from the Azores Single Male Poverty

Single Male Poverty Correlation Summary

MeasurementScotch-IrishImmigrants from the Azores
Minimum6.4%1.7%
Maximum100.0%31.9%
Range93.6%30.2%
Mean41.7%13.5%
Median30.0%11.6%
Interquartile 25% (IQ1)18.7%9.3%
Interquartile 75% (IQ3)67.0%17.1%
Interquartile Range (IQR)48.3%7.8%
Standard Deviation (Sample)28.9%7.2%
Standard Deviation (Population)28.5%7.1%

Similar Demographics by Single Male Poverty

Demographics Similar to Scotch-Irish by Single Male Poverty

In terms of single male poverty, the demographic groups most similar to Scotch-Irish are African (14.7%, a difference of 0.33%), Ottawa (14.6%, a difference of 0.44%), French Canadian (14.6%, a difference of 0.63%), Immigrants from Dominican Republic (14.8%, a difference of 0.67%), and Nonimmigrants (14.6%, a difference of 0.74%).
DemographicsRating | RankSingle Male Poverty
Whites/Caucasians
0.0
/100
|
#288
Tragic
14.5%
Immigrants | Dominica
0.0
/100
|
#289
Tragic
14.5%
U.S. Virgin Islanders
0.0
/100
|
#290
Tragic
14.5%
Bahamians
0.0
/100
|
#291
Tragic
14.6%
Immigrants | Nonimmigrants
0.0
/100
|
#292
Tragic
14.6%
French Canadians
0.0
/100
|
#293
Tragic
14.6%
Ottawa
0.0
/100
|
#294
Tragic
14.6%
Scotch-Irish
0.0
/100
|
#295
Tragic
14.7%
Africans
0.0
/100
|
#296
Tragic
14.7%
Immigrants | Dominican Republic
0.0
/100
|
#297
Tragic
14.8%
French American Indians
0.0
/100
|
#298
Tragic
15.0%
Delaware
0.0
/100
|
#299
Tragic
15.0%
Cree
0.0
/100
|
#300
Tragic
15.1%
Dominicans
0.0
/100
|
#301
Tragic
15.2%
Alsatians
0.0
/100
|
#302
Tragic
15.2%

Demographics Similar to Immigrants from the Azores by Single Male Poverty

In terms of single male poverty, the demographic groups most similar to Immigrants from the Azores are Somali (13.2%, a difference of 0.030%), Immigrants from Denmark (13.2%, a difference of 0.090%), Immigrants from Western Europe (13.2%, a difference of 0.11%), New Zealander (13.2%, a difference of 0.20%), and Central American (13.2%, a difference of 0.23%).
DemographicsRating | RankSingle Male Poverty
Austrians
13.9
/100
|
#216
Poor
13.1%
Bermudans
13.0
/100
|
#217
Poor
13.1%
Scandinavians
12.9
/100
|
#218
Poor
13.1%
Immigrants | Burma/Myanmar
12.6
/100
|
#219
Poor
13.1%
Central Americans
10.9
/100
|
#220
Poor
13.2%
New Zealanders
10.7
/100
|
#221
Poor
13.2%
Immigrants | Western Europe
10.0
/100
|
#222
Poor
13.2%
Immigrants | Azores
9.3
/100
|
#223
Tragic
13.2%
Somalis
9.1
/100
|
#224
Tragic
13.2%
Immigrants | Denmark
8.7
/100
|
#225
Tragic
13.2%
Jamaicans
7.7
/100
|
#226
Tragic
13.2%
Haitians
7.0
/100
|
#227
Tragic
13.2%
Lebanese
6.6
/100
|
#228
Tragic
13.2%
Europeans
6.2
/100
|
#229
Tragic
13.3%
Ghanaians
6.1
/100
|
#230
Tragic
13.3%