Immigrants from Thailand vs Immigrants from China Single Male Poverty
COMPARE
Immigrants from Thailand
Immigrants from China
Single Male Poverty
Single Male Poverty Comparison
Immigrants from Thailand
Immigrants from China
13.0%
SINGLE MALE POVERTY
26.6/ 100
METRIC RATING
191st/ 347
METRIC RANK
11.4%
SINGLE MALE POVERTY
100.0/ 100
METRIC RATING
27th/ 347
METRIC RANK
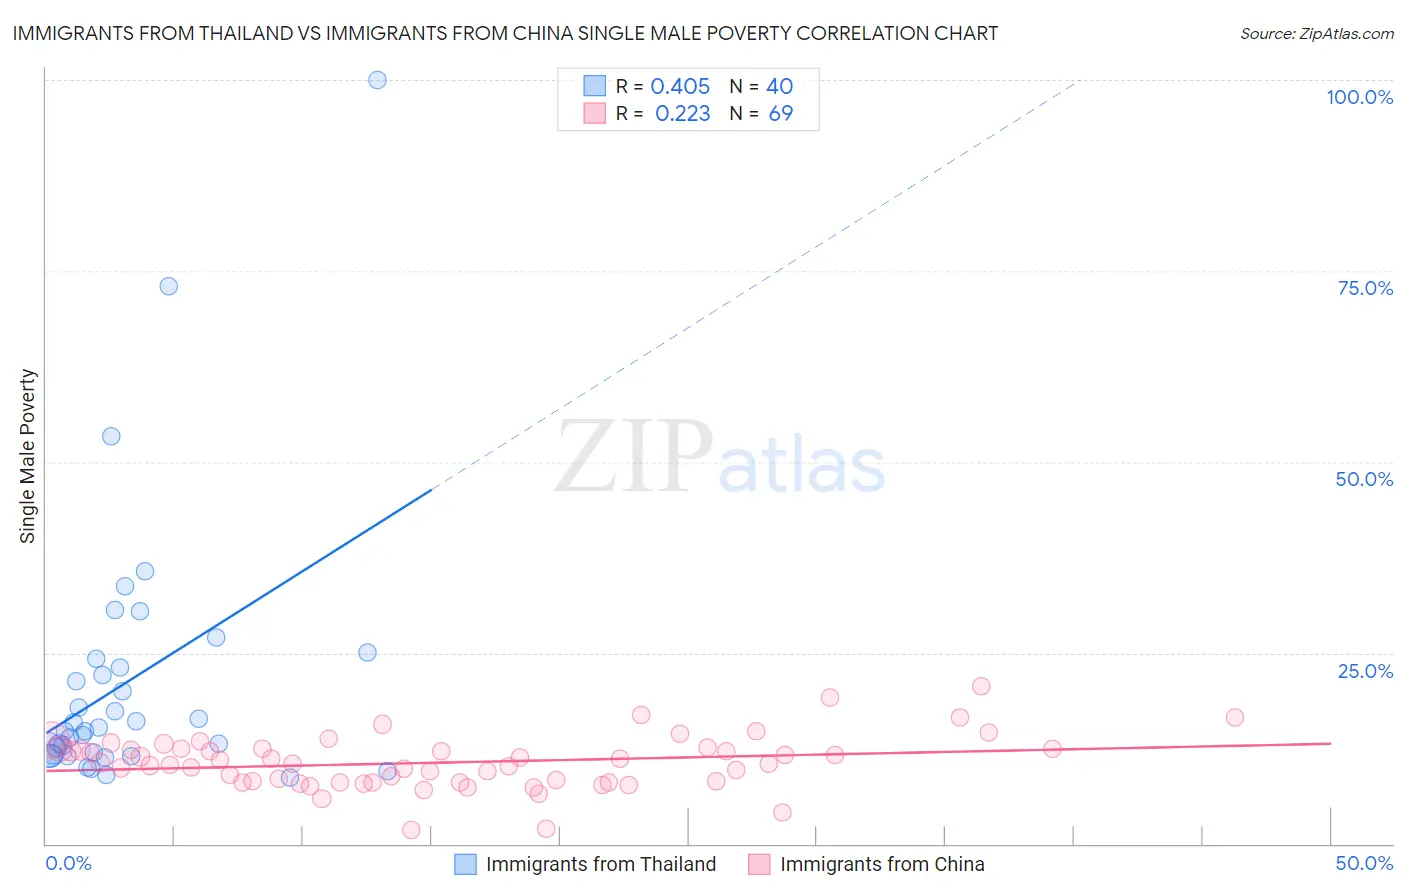
Immigrants from Thailand vs Immigrants from China Single Male Poverty Correlation Chart
The statistical analysis conducted on geographies consisting of 289,372,326 people shows a moderate positive correlation between the proportion of Immigrants from Thailand and poverty level among single males in the United States with a correlation coefficient (R) of 0.405 and weighted average of 13.0%. Similarly, the statistical analysis conducted on geographies consisting of 395,740,575 people shows a weak positive correlation between the proportion of Immigrants from China and poverty level among single males in the United States with a correlation coefficient (R) of 0.223 and weighted average of 11.4%, a difference of 14.0%.
Single Male Poverty Correlation Summary
| Measurement | Immigrants from Thailand | Immigrants from China |
| Minimum | 8.7% | 1.7% |
| Maximum | 100.0% | 20.6% |
| Range | 91.3% | 18.8% |
| Mean | 21.4% | 10.6% |
| Median | 15.0% | 10.5% |
| Interquartile 25% (IQ1) | 11.8% | 8.0% |
| Interquartile 75% (IQ3) | 23.6% | 12.4% |
| Interquartile Range (IQR) | 11.8% | 4.4% |
| Standard Deviation (Sample) | 17.9% | 3.4% |
| Standard Deviation (Population) | 17.7% | 3.4% |
Similar Demographics by Single Male Poverty
Demographics Similar to Immigrants from Thailand by Single Male Poverty
In terms of single male poverty, the demographic groups most similar to Immigrants from Thailand are Immigrants from Jamaica (13.0%, a difference of 0.010%), Arab (13.0%, a difference of 0.030%), Immigrants from South Africa (13.0%, a difference of 0.030%), Liberian (13.0%, a difference of 0.090%), and Immigrants from England (13.0%, a difference of 0.22%).
| Demographics | Rating | Rank | Single Male Poverty |
| Immigrants | Trinidad and Tobago | 32.5 /100 | #184 | Fair 12.9% |
| Norwegians | 32.0 /100 | #185 | Fair 12.9% |
| Nigerians | 31.9 /100 | #186 | Fair 12.9% |
| Immigrants | Kuwait | 31.9 /100 | #187 | Fair 12.9% |
| Macedonians | 31.5 /100 | #188 | Fair 12.9% |
| Portuguese | 30.2 /100 | #189 | Fair 12.9% |
| Arabs | 27.0 /100 | #190 | Fair 13.0% |
| Immigrants | Thailand | 26.6 /100 | #191 | Fair 13.0% |
| Immigrants | Jamaica | 26.5 /100 | #192 | Fair 13.0% |
| Immigrants | South Africa | 26.1 /100 | #193 | Fair 13.0% |
| Liberians | 25.2 /100 | #194 | Fair 13.0% |
| Immigrants | England | 23.4 /100 | #195 | Fair 13.0% |
| Immigrants | Grenada | 23.1 /100 | #196 | Fair 13.0% |
| Immigrants | Laos | 23.1 /100 | #197 | Fair 13.0% |
| Lithuanians | 22.1 /100 | #198 | Fair 13.0% |
Demographics Similar to Immigrants from China by Single Male Poverty
In terms of single male poverty, the demographic groups most similar to Immigrants from China are Immigrants from Asia (11.4%, a difference of 0.070%), Immigrants from Egypt (11.4%, a difference of 0.17%), Iranian (11.4%, a difference of 0.23%), Immigrants from Iran (11.4%, a difference of 0.32%), and Immigrants from Eastern Asia (11.4%, a difference of 0.40%).
| Demographics | Rating | Rank | Single Male Poverty |
| Ethiopians | 100.0 /100 | #20 | Exceptional 11.2% |
| Asians | 100.0 /100 | #21 | Exceptional 11.2% |
| Immigrants | Pakistan | 100.0 /100 | #22 | Exceptional 11.2% |
| Bolivians | 100.0 /100 | #23 | Exceptional 11.2% |
| Indians (Asian) | 100.0 /100 | #24 | Exceptional 11.3% |
| Maltese | 100.0 /100 | #25 | Exceptional 11.3% |
| Immigrants | Japan | 100.0 /100 | #26 | Exceptional 11.3% |
| Immigrants | China | 100.0 /100 | #27 | Exceptional 11.4% |
| Immigrants | Asia | 100.0 /100 | #28 | Exceptional 11.4% |
| Immigrants | Egypt | 100.0 /100 | #29 | Exceptional 11.4% |
| Iranians | 100.0 /100 | #30 | Exceptional 11.4% |
| Immigrants | Iran | 100.0 /100 | #31 | Exceptional 11.4% |
| Immigrants | Eastern Asia | 100.0 /100 | #32 | Exceptional 11.4% |
| Immigrants | Vietnam | 100.0 /100 | #33 | Exceptional 11.4% |
| Immigrants | Ethiopia | 100.0 /100 | #34 | Exceptional 11.4% |