Scotch-Irish vs Immigrants from Northern Africa Single Male Poverty
COMPARE
Scotch-Irish
Immigrants from Northern Africa
Single Male Poverty
Single Male Poverty Comparison
Scotch-Irish
Immigrants from Northern Africa
14.7%
SINGLE MALE POVERTY
0.0/ 100
METRIC RATING
295th/ 347
METRIC RANK
11.9%
SINGLE MALE POVERTY
99.4/ 100
METRIC RATING
76th/ 347
METRIC RANK
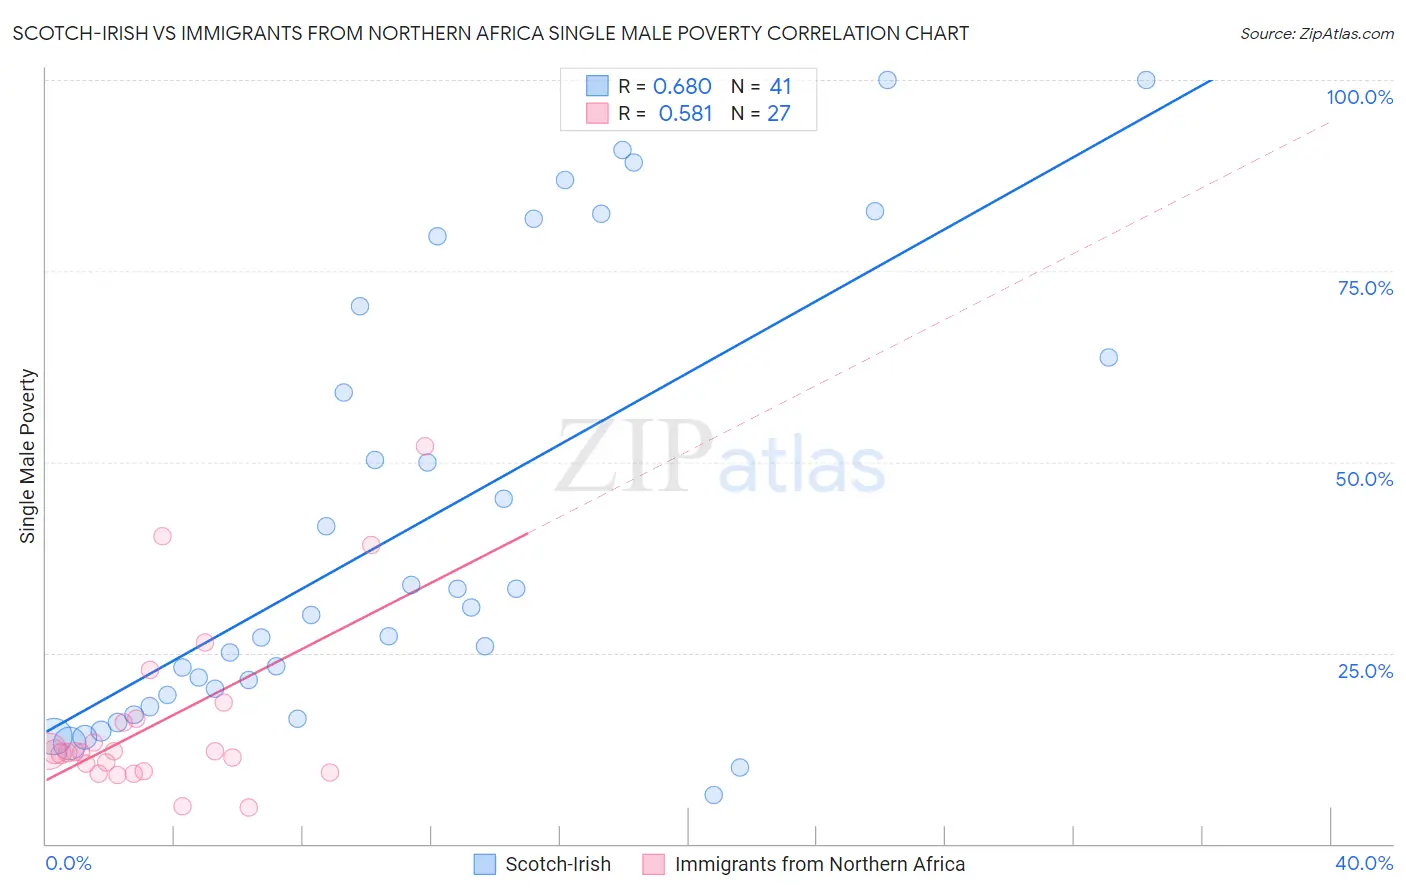
Scotch-Irish vs Immigrants from Northern Africa Single Male Poverty Correlation Chart
The statistical analysis conducted on geographies consisting of 456,240,238 people shows a significant positive correlation between the proportion of Scotch-Irish and poverty level among single males in the United States with a correlation coefficient (R) of 0.680 and weighted average of 14.7%. Similarly, the statistical analysis conducted on geographies consisting of 289,323,815 people shows a substantial positive correlation between the proportion of Immigrants from Northern Africa and poverty level among single males in the United States with a correlation coefficient (R) of 0.581 and weighted average of 11.9%, a difference of 22.9%.
Single Male Poverty Correlation Summary
| Measurement | Scotch-Irish | Immigrants from Northern Africa |
| Minimum | 6.4% | 4.7% |
| Maximum | 100.0% | 52.0% |
| Range | 93.6% | 47.3% |
| Mean | 41.7% | 15.9% |
| Median | 30.0% | 12.0% |
| Interquartile 25% (IQ1) | 18.7% | 9.6% |
| Interquartile 75% (IQ3) | 67.0% | 16.4% |
| Interquartile Range (IQR) | 48.3% | 6.8% |
| Standard Deviation (Sample) | 28.9% | 11.2% |
| Standard Deviation (Population) | 28.5% | 11.0% |
Similar Demographics by Single Male Poverty
Demographics Similar to Scotch-Irish by Single Male Poverty
In terms of single male poverty, the demographic groups most similar to Scotch-Irish are African (14.7%, a difference of 0.33%), Ottawa (14.6%, a difference of 0.44%), French Canadian (14.6%, a difference of 0.63%), Immigrants from Dominican Republic (14.8%, a difference of 0.67%), and Nonimmigrants (14.6%, a difference of 0.74%).
| Demographics | Rating | Rank | Single Male Poverty |
| Whites/Caucasians | 0.0 /100 | #288 | Tragic 14.5% |
| Immigrants | Dominica | 0.0 /100 | #289 | Tragic 14.5% |
| U.S. Virgin Islanders | 0.0 /100 | #290 | Tragic 14.5% |
| Bahamians | 0.0 /100 | #291 | Tragic 14.6% |
| Immigrants | Nonimmigrants | 0.0 /100 | #292 | Tragic 14.6% |
| French Canadians | 0.0 /100 | #293 | Tragic 14.6% |
| Ottawa | 0.0 /100 | #294 | Tragic 14.6% |
| Scotch-Irish | 0.0 /100 | #295 | Tragic 14.7% |
| Africans | 0.0 /100 | #296 | Tragic 14.7% |
| Immigrants | Dominican Republic | 0.0 /100 | #297 | Tragic 14.8% |
| French American Indians | 0.0 /100 | #298 | Tragic 15.0% |
| Delaware | 0.0 /100 | #299 | Tragic 15.0% |
| Cree | 0.0 /100 | #300 | Tragic 15.1% |
| Dominicans | 0.0 /100 | #301 | Tragic 15.2% |
| Alsatians | 0.0 /100 | #302 | Tragic 15.2% |
Demographics Similar to Immigrants from Northern Africa by Single Male Poverty
In terms of single male poverty, the demographic groups most similar to Immigrants from Northern Africa are Uruguayan (11.9%, a difference of 0.020%), Chilean (11.9%, a difference of 0.22%), Immigrants from Malaysia (12.0%, a difference of 0.26%), Argentinean (11.9%, a difference of 0.27%), and Immigrants from Argentina (11.9%, a difference of 0.40%).
| Demographics | Rating | Rank | Single Male Poverty |
| Immigrants | Russia | 99.6 /100 | #69 | Exceptional 11.9% |
| Immigrants | Nepal | 99.6 /100 | #70 | Exceptional 11.9% |
| Immigrants | Greece | 99.6 /100 | #71 | Exceptional 11.9% |
| Immigrants | Argentina | 99.5 /100 | #72 | Exceptional 11.9% |
| Argentineans | 99.5 /100 | #73 | Exceptional 11.9% |
| Chileans | 99.5 /100 | #74 | Exceptional 11.9% |
| Uruguayans | 99.4 /100 | #75 | Exceptional 11.9% |
| Immigrants | Northern Africa | 99.4 /100 | #76 | Exceptional 11.9% |
| Immigrants | Malaysia | 99.2 /100 | #77 | Exceptional 12.0% |
| Immigrants | Venezuela | 99.1 /100 | #78 | Exceptional 12.0% |
| Immigrants | Belgium | 99.0 /100 | #79 | Exceptional 12.0% |
| Armenians | 98.7 /100 | #80 | Exceptional 12.1% |
| Immigrants | South America | 98.7 /100 | #81 | Exceptional 12.1% |
| Immigrants | Colombia | 98.6 /100 | #82 | Exceptional 12.1% |
| Immigrants | Chile | 98.6 /100 | #83 | Exceptional 12.1% |