Scotch-Irish vs Immigrants from Belarus Single Male Poverty
COMPARE
Scotch-Irish
Immigrants from Belarus
Single Male Poverty
Single Male Poverty Comparison
Scotch-Irish
Immigrants from Belarus
14.7%
SINGLE MALE POVERTY
0.0/ 100
METRIC RATING
295th/ 347
METRIC RANK
11.8%
SINGLE MALE POVERTY
99.7/ 100
METRIC RATING
63rd/ 347
METRIC RANK
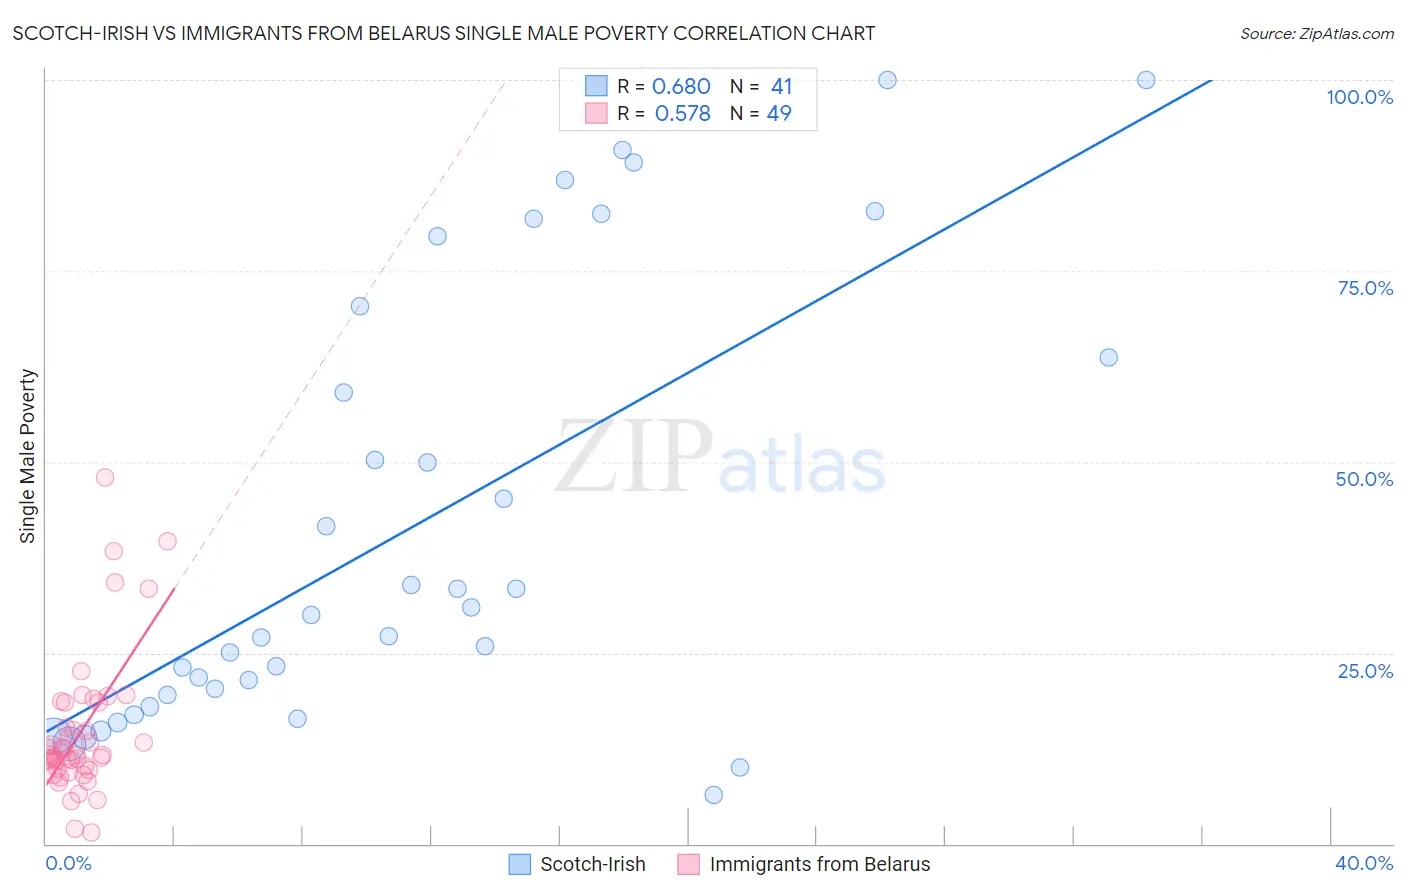
Scotch-Irish vs Immigrants from Belarus Single Male Poverty Correlation Chart
The statistical analysis conducted on geographies consisting of 456,240,238 people shows a significant positive correlation between the proportion of Scotch-Irish and poverty level among single males in the United States with a correlation coefficient (R) of 0.680 and weighted average of 14.7%. Similarly, the statistical analysis conducted on geographies consisting of 138,467,710 people shows a substantial positive correlation between the proportion of Immigrants from Belarus and poverty level among single males in the United States with a correlation coefficient (R) of 0.578 and weighted average of 11.8%, a difference of 24.1%.
Single Male Poverty Correlation Summary
| Measurement | Scotch-Irish | Immigrants from Belarus |
| Minimum | 6.4% | 1.5% |
| Maximum | 100.0% | 48.0% |
| Range | 93.6% | 46.5% |
| Mean | 41.7% | 14.7% |
| Median | 30.0% | 11.6% |
| Interquartile 25% (IQ1) | 18.7% | 9.8% |
| Interquartile 75% (IQ3) | 67.0% | 18.5% |
| Interquartile Range (IQR) | 48.3% | 8.8% |
| Standard Deviation (Sample) | 28.9% | 9.4% |
| Standard Deviation (Population) | 28.5% | 9.3% |
Similar Demographics by Single Male Poverty
Demographics Similar to Scotch-Irish by Single Male Poverty
In terms of single male poverty, the demographic groups most similar to Scotch-Irish are African (14.7%, a difference of 0.33%), Ottawa (14.6%, a difference of 0.44%), French Canadian (14.6%, a difference of 0.63%), Immigrants from Dominican Republic (14.8%, a difference of 0.67%), and Nonimmigrants (14.6%, a difference of 0.74%).
| Demographics | Rating | Rank | Single Male Poverty |
| Whites/Caucasians | 0.0 /100 | #288 | Tragic 14.5% |
| Immigrants | Dominica | 0.0 /100 | #289 | Tragic 14.5% |
| U.S. Virgin Islanders | 0.0 /100 | #290 | Tragic 14.5% |
| Bahamians | 0.0 /100 | #291 | Tragic 14.6% |
| Immigrants | Nonimmigrants | 0.0 /100 | #292 | Tragic 14.6% |
| French Canadians | 0.0 /100 | #293 | Tragic 14.6% |
| Ottawa | 0.0 /100 | #294 | Tragic 14.6% |
| Scotch-Irish | 0.0 /100 | #295 | Tragic 14.7% |
| Africans | 0.0 /100 | #296 | Tragic 14.7% |
| Immigrants | Dominican Republic | 0.0 /100 | #297 | Tragic 14.8% |
| French American Indians | 0.0 /100 | #298 | Tragic 15.0% |
| Delaware | 0.0 /100 | #299 | Tragic 15.0% |
| Cree | 0.0 /100 | #300 | Tragic 15.1% |
| Dominicans | 0.0 /100 | #301 | Tragic 15.2% |
| Alsatians | 0.0 /100 | #302 | Tragic 15.2% |
Demographics Similar to Immigrants from Belarus by Single Male Poverty
In terms of single male poverty, the demographic groups most similar to Immigrants from Belarus are Immigrants from Sri Lanka (11.8%, a difference of 0.050%), Immigrants from Eastern Europe (11.8%, a difference of 0.14%), Laotian (11.9%, a difference of 0.23%), Immigrants from Uruguay (11.9%, a difference of 0.23%), and Immigrants from Ukraine (11.9%, a difference of 0.25%).
| Demographics | Rating | Rank | Single Male Poverty |
| Burmese | 99.8 /100 | #56 | Exceptional 11.7% |
| Immigrants | Romania | 99.8 /100 | #57 | Exceptional 11.7% |
| Immigrants | Brazil | 99.8 /100 | #58 | Exceptional 11.7% |
| Brazilians | 99.8 /100 | #59 | Exceptional 11.8% |
| Peruvians | 99.8 /100 | #60 | Exceptional 11.8% |
| Cambodians | 99.8 /100 | #61 | Exceptional 11.8% |
| Immigrants | Sri Lanka | 99.7 /100 | #62 | Exceptional 11.8% |
| Immigrants | Belarus | 99.7 /100 | #63 | Exceptional 11.8% |
| Immigrants | Eastern Europe | 99.6 /100 | #64 | Exceptional 11.8% |
| Laotians | 99.6 /100 | #65 | Exceptional 11.9% |
| Immigrants | Uruguay | 99.6 /100 | #66 | Exceptional 11.9% |
| Immigrants | Ukraine | 99.6 /100 | #67 | Exceptional 11.9% |
| Immigrants | Croatia | 99.6 /100 | #68 | Exceptional 11.9% |
| Immigrants | Russia | 99.6 /100 | #69 | Exceptional 11.9% |
| Immigrants | Nepal | 99.6 /100 | #70 | Exceptional 11.9% |