Scandinavian vs Iranian Single Male Poverty
COMPARE
Scandinavian
Iranian
Single Male Poverty
Single Male Poverty Comparison
Scandinavians
Iranians
13.1%
SINGLE MALE POVERTY
12.9/ 100
METRIC RATING
218th/ 347
METRIC RANK
11.4%
SINGLE MALE POVERTY
100.0/ 100
METRIC RATING
30th/ 347
METRIC RANK
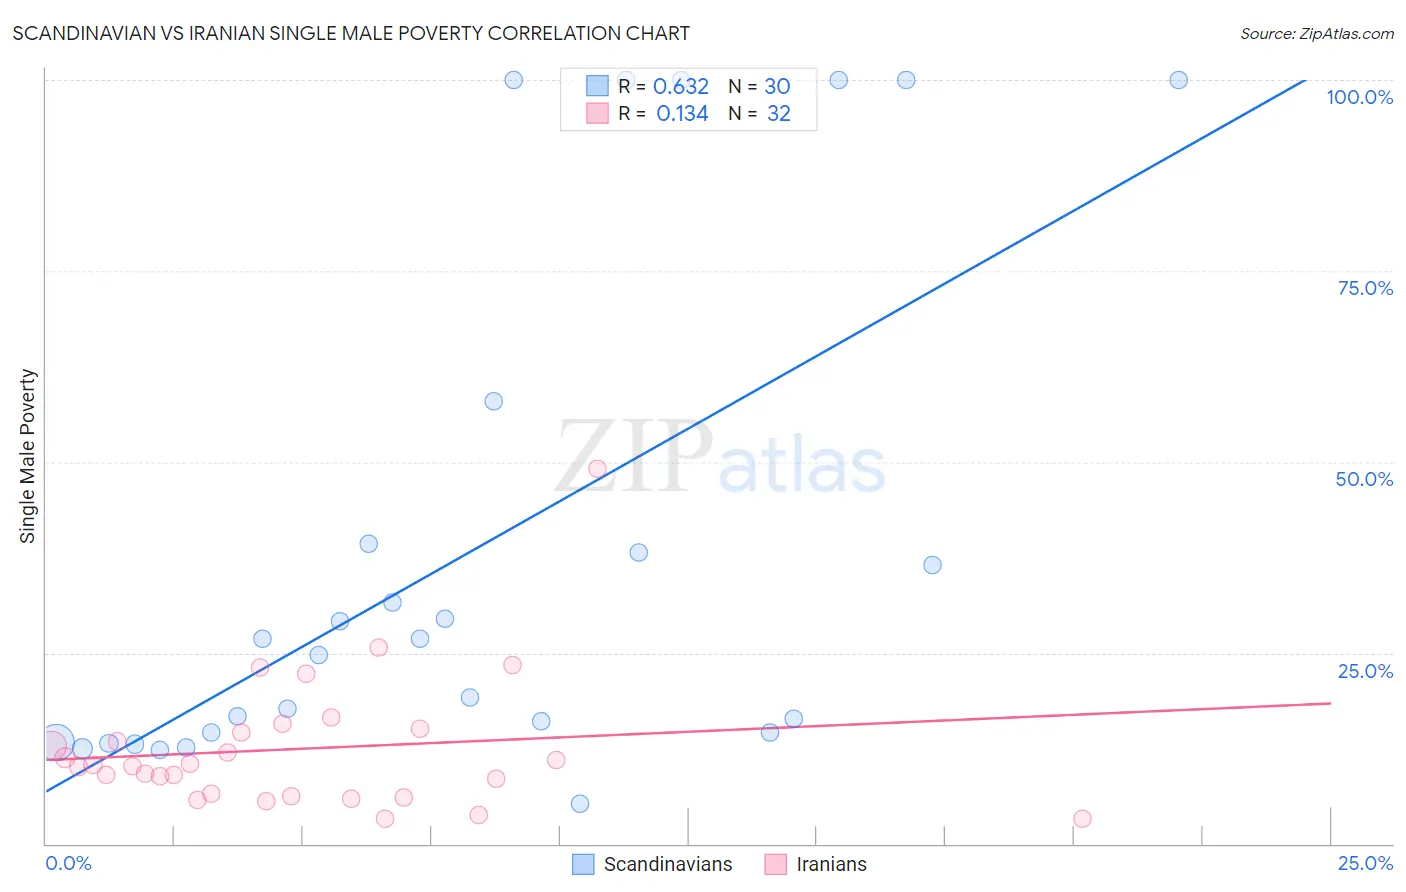
Scandinavian vs Iranian Single Male Poverty Correlation Chart
The statistical analysis conducted on geographies consisting of 403,484,518 people shows a significant positive correlation between the proportion of Scandinavians and poverty level among single males in the United States with a correlation coefficient (R) of 0.632 and weighted average of 13.1%. Similarly, the statistical analysis conducted on geographies consisting of 284,868,463 people shows a poor positive correlation between the proportion of Iranians and poverty level among single males in the United States with a correlation coefficient (R) of 0.134 and weighted average of 11.4%, a difference of 15.0%.
Single Male Poverty Correlation Summary
| Measurement | Scandinavian | Iranian |
| Minimum | 5.2% | 3.2% |
| Maximum | 100.0% | 49.0% |
| Range | 94.8% | 45.8% |
| Mean | 37.9% | 12.4% |
| Median | 25.7% | 10.2% |
| Interquartile 25% (IQ1) | 14.5% | 6.4% |
| Interquartile 75% (IQ3) | 39.3% | 14.8% |
| Interquartile Range (IQR) | 24.8% | 8.4% |
| Standard Deviation (Sample) | 33.3% | 8.9% |
| Standard Deviation (Population) | 32.8% | 8.8% |
Similar Demographics by Single Male Poverty
Demographics Similar to Scandinavians by Single Male Poverty
In terms of single male poverty, the demographic groups most similar to Scandinavians are Bermudan (13.1%, a difference of 0.020%), Immigrants from Burma/Myanmar (13.1%, a difference of 0.030%), Austrian (13.1%, a difference of 0.11%), Japanese (13.1%, a difference of 0.21%), and Zimbabwean (13.1%, a difference of 0.22%).
| Demographics | Rating | Rank | Single Male Poverty |
| Swedes | 16.8 /100 | #211 | Poor 13.1% |
| Senegalese | 16.4 /100 | #212 | Poor 13.1% |
| Italians | 15.9 /100 | #213 | Poor 13.1% |
| Zimbabweans | 14.9 /100 | #214 | Poor 13.1% |
| Japanese | 14.8 /100 | #215 | Poor 13.1% |
| Austrians | 13.9 /100 | #216 | Poor 13.1% |
| Bermudans | 13.0 /100 | #217 | Poor 13.1% |
| Scandinavians | 12.9 /100 | #218 | Poor 13.1% |
| Immigrants | Burma/Myanmar | 12.6 /100 | #219 | Poor 13.1% |
| Central Americans | 10.9 /100 | #220 | Poor 13.2% |
| New Zealanders | 10.7 /100 | #221 | Poor 13.2% |
| Immigrants | Western Europe | 10.0 /100 | #222 | Poor 13.2% |
| Immigrants | Azores | 9.3 /100 | #223 | Tragic 13.2% |
| Somalis | 9.1 /100 | #224 | Tragic 13.2% |
| Immigrants | Denmark | 8.7 /100 | #225 | Tragic 13.2% |
Demographics Similar to Iranians by Single Male Poverty
In terms of single male poverty, the demographic groups most similar to Iranians are Immigrants from Egypt (11.4%, a difference of 0.060%), Immigrants from Iran (11.4%, a difference of 0.090%), Immigrants from Asia (11.4%, a difference of 0.16%), Immigrants from Eastern Asia (11.4%, a difference of 0.18%), and Immigrants from China (11.4%, a difference of 0.23%).
| Demographics | Rating | Rank | Single Male Poverty |
| Bolivians | 100.0 /100 | #23 | Exceptional 11.2% |
| Indians (Asian) | 100.0 /100 | #24 | Exceptional 11.3% |
| Maltese | 100.0 /100 | #25 | Exceptional 11.3% |
| Immigrants | Japan | 100.0 /100 | #26 | Exceptional 11.3% |
| Immigrants | China | 100.0 /100 | #27 | Exceptional 11.4% |
| Immigrants | Asia | 100.0 /100 | #28 | Exceptional 11.4% |
| Immigrants | Egypt | 100.0 /100 | #29 | Exceptional 11.4% |
| Iranians | 100.0 /100 | #30 | Exceptional 11.4% |
| Immigrants | Iran | 100.0 /100 | #31 | Exceptional 11.4% |
| Immigrants | Eastern Asia | 100.0 /100 | #32 | Exceptional 11.4% |
| Immigrants | Vietnam | 100.0 /100 | #33 | Exceptional 11.4% |
| Immigrants | Ethiopia | 100.0 /100 | #34 | Exceptional 11.4% |
| Immigrants | South Eastern Asia | 100.0 /100 | #35 | Exceptional 11.4% |
| Immigrants | Serbia | 100.0 /100 | #36 | Exceptional 11.4% |
| Immigrants | Singapore | 100.0 /100 | #37 | Exceptional 11.4% |