Scandinavian vs Immigrants from Barbados Single Male Poverty
COMPARE
Scandinavian
Immigrants from Barbados
Single Male Poverty
Single Male Poverty Comparison
Scandinavians
Immigrants from Barbados
13.1%
SINGLE MALE POVERTY
12.9/ 100
METRIC RATING
218th/ 347
METRIC RANK
12.7%
SINGLE MALE POVERTY
57.7/ 100
METRIC RATING
168th/ 347
METRIC RANK
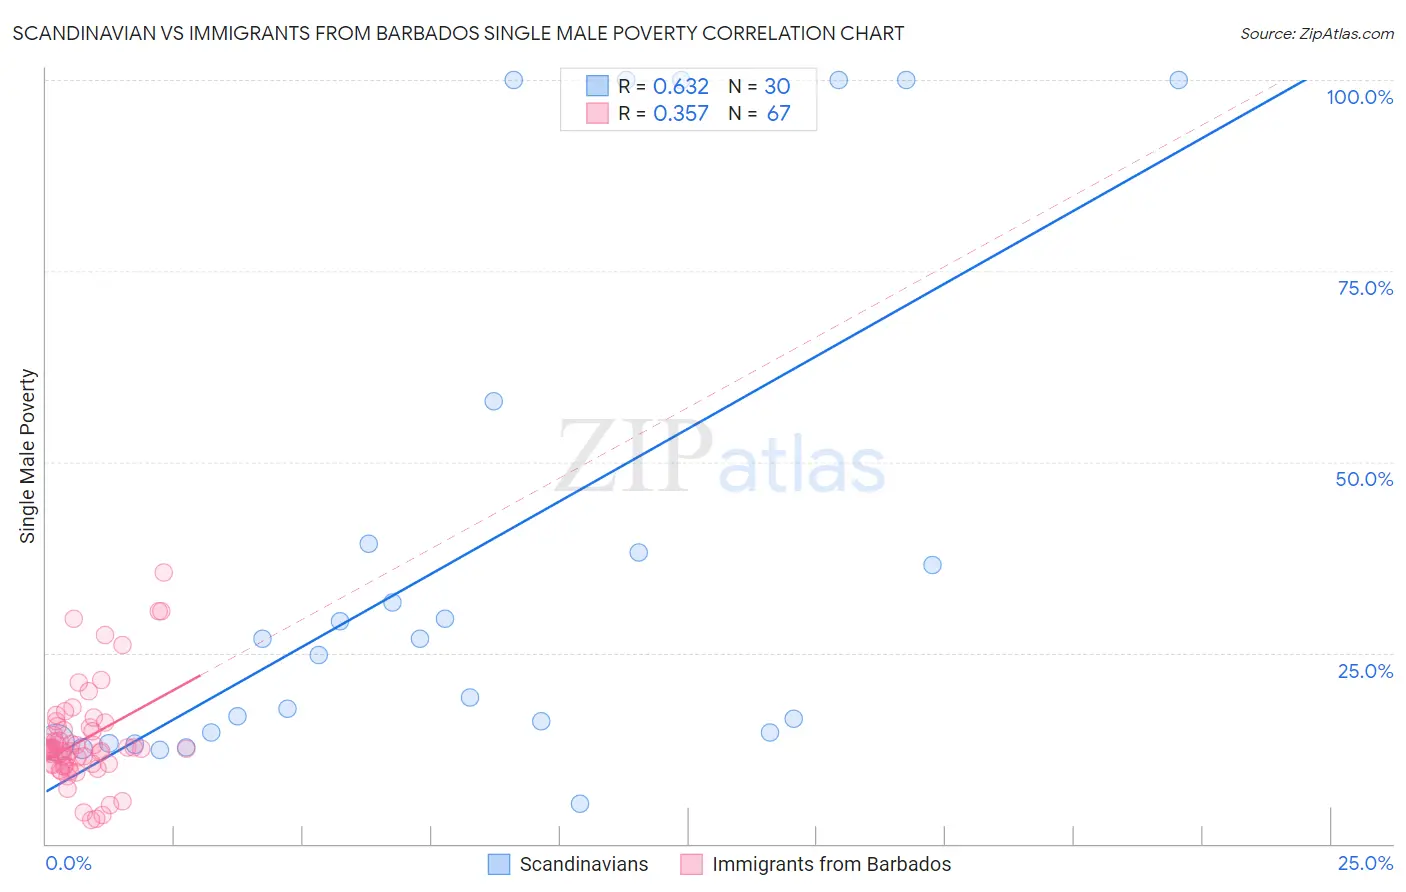
Scandinavian vs Immigrants from Barbados Single Male Poverty Correlation Chart
The statistical analysis conducted on geographies consisting of 403,484,518 people shows a significant positive correlation between the proportion of Scandinavians and poverty level among single males in the United States with a correlation coefficient (R) of 0.632 and weighted average of 13.1%. Similarly, the statistical analysis conducted on geographies consisting of 108,546,414 people shows a mild positive correlation between the proportion of Immigrants from Barbados and poverty level among single males in the United States with a correlation coefficient (R) of 0.357 and weighted average of 12.7%, a difference of 2.9%.
Single Male Poverty Correlation Summary
| Measurement | Scandinavian | Immigrants from Barbados |
| Minimum | 5.2% | 3.1% |
| Maximum | 100.0% | 35.5% |
| Range | 94.8% | 32.4% |
| Mean | 37.9% | 13.6% |
| Median | 25.7% | 12.4% |
| Interquartile 25% (IQ1) | 14.5% | 10.3% |
| Interquartile 75% (IQ3) | 39.3% | 15.2% |
| Interquartile Range (IQR) | 24.8% | 4.8% |
| Standard Deviation (Sample) | 33.3% | 6.4% |
| Standard Deviation (Population) | 32.8% | 6.3% |
Similar Demographics by Single Male Poverty
Demographics Similar to Scandinavians by Single Male Poverty
In terms of single male poverty, the demographic groups most similar to Scandinavians are Bermudan (13.1%, a difference of 0.020%), Immigrants from Burma/Myanmar (13.1%, a difference of 0.030%), Austrian (13.1%, a difference of 0.11%), Japanese (13.1%, a difference of 0.21%), and Zimbabwean (13.1%, a difference of 0.22%).
| Demographics | Rating | Rank | Single Male Poverty |
| Swedes | 16.8 /100 | #211 | Poor 13.1% |
| Senegalese | 16.4 /100 | #212 | Poor 13.1% |
| Italians | 15.9 /100 | #213 | Poor 13.1% |
| Zimbabweans | 14.9 /100 | #214 | Poor 13.1% |
| Japanese | 14.8 /100 | #215 | Poor 13.1% |
| Austrians | 13.9 /100 | #216 | Poor 13.1% |
| Bermudans | 13.0 /100 | #217 | Poor 13.1% |
| Scandinavians | 12.9 /100 | #218 | Poor 13.1% |
| Immigrants | Burma/Myanmar | 12.6 /100 | #219 | Poor 13.1% |
| Central Americans | 10.9 /100 | #220 | Poor 13.2% |
| New Zealanders | 10.7 /100 | #221 | Poor 13.2% |
| Immigrants | Western Europe | 10.0 /100 | #222 | Poor 13.2% |
| Immigrants | Azores | 9.3 /100 | #223 | Tragic 13.2% |
| Somalis | 9.1 /100 | #224 | Tragic 13.2% |
| Immigrants | Denmark | 8.7 /100 | #225 | Tragic 13.2% |
Demographics Similar to Immigrants from Barbados by Single Male Poverty
In terms of single male poverty, the demographic groups most similar to Immigrants from Barbados are Immigrants from Sudan (12.7%, a difference of 0.030%), Immigrants from Guyana (12.7%, a difference of 0.15%), Puget Sound Salish (12.8%, a difference of 0.18%), Immigrants from Cambodia (12.7%, a difference of 0.25%), and Immigrants from Nigeria (12.7%, a difference of 0.28%).
| Demographics | Rating | Rank | Single Male Poverty |
| Immigrants | Africa | 63.4 /100 | #161 | Good 12.7% |
| Eastern Europeans | 63.3 /100 | #162 | Good 12.7% |
| Palestinians | 63.1 /100 | #163 | Good 12.7% |
| Immigrants | Nigeria | 62.8 /100 | #164 | Good 12.7% |
| Immigrants | Cambodia | 62.2 /100 | #165 | Good 12.7% |
| Immigrants | Guyana | 60.5 /100 | #166 | Good 12.7% |
| Immigrants | Sudan | 58.2 /100 | #167 | Average 12.7% |
| Immigrants | Barbados | 57.7 /100 | #168 | Average 12.7% |
| Puget Sound Salish | 54.3 /100 | #169 | Average 12.8% |
| Guyanese | 52.0 /100 | #170 | Average 12.8% |
| South Africans | 51.5 /100 | #171 | Average 12.8% |
| Danes | 51.4 /100 | #172 | Average 12.8% |
| Immigrants | St. Vincent and the Grenadines | 50.9 /100 | #173 | Average 12.8% |
| Costa Ricans | 50.0 /100 | #174 | Average 12.8% |
| Croatians | 48.9 /100 | #175 | Average 12.8% |