Scandinavian vs Immigrants from Laos Single Male Poverty
COMPARE
Scandinavian
Immigrants from Laos
Single Male Poverty
Single Male Poverty Comparison
Scandinavians
Immigrants from Laos
13.1%
SINGLE MALE POVERTY
12.9/ 100
METRIC RATING
218th/ 347
METRIC RANK
13.0%
SINGLE MALE POVERTY
23.1/ 100
METRIC RATING
197th/ 347
METRIC RANK
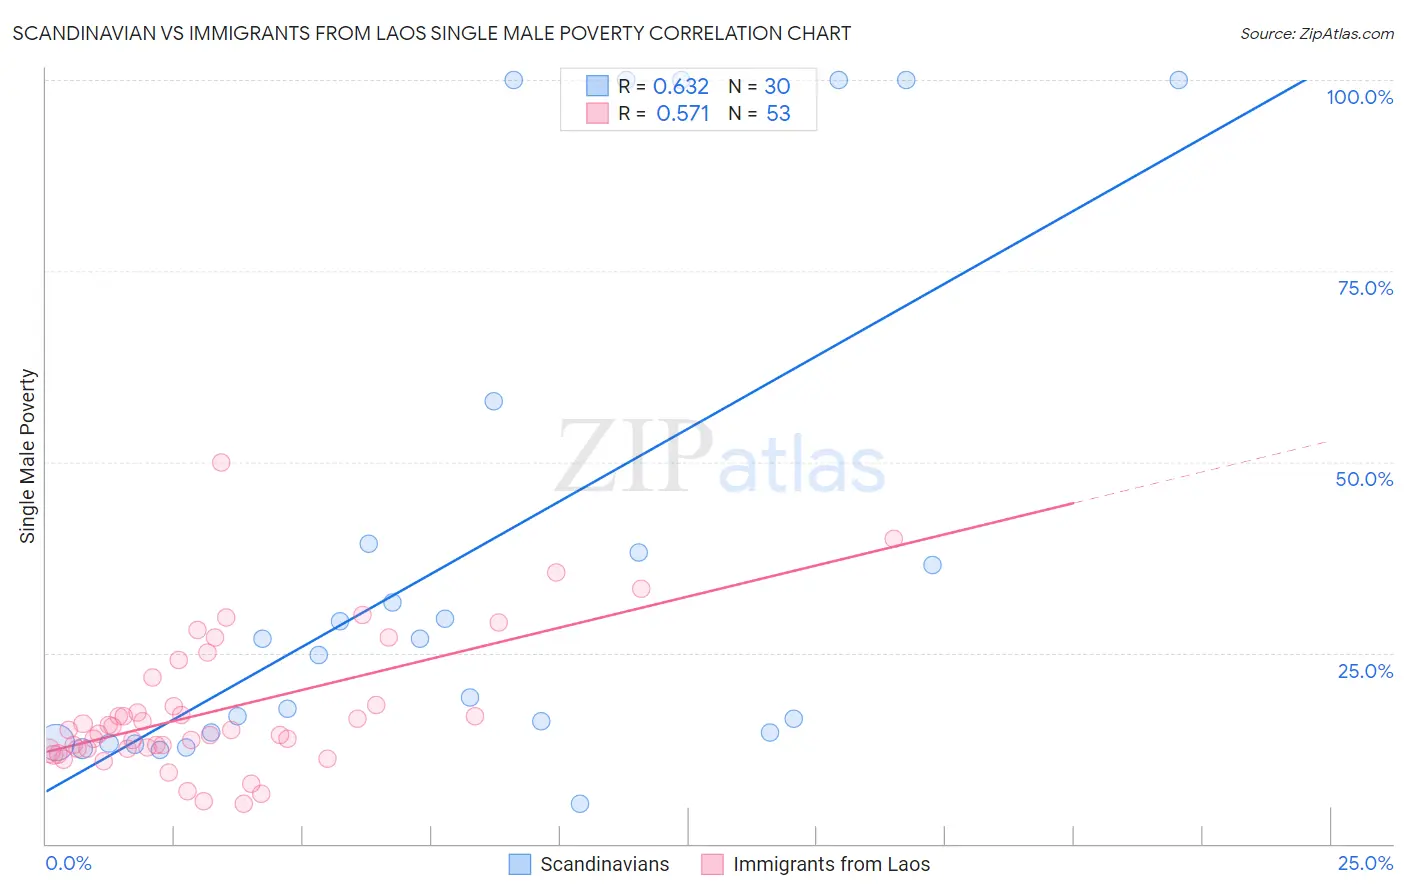
Scandinavian vs Immigrants from Laos Single Male Poverty Correlation Chart
The statistical analysis conducted on geographies consisting of 403,484,518 people shows a significant positive correlation between the proportion of Scandinavians and poverty level among single males in the United States with a correlation coefficient (R) of 0.632 and weighted average of 13.1%. Similarly, the statistical analysis conducted on geographies consisting of 188,644,362 people shows a substantial positive correlation between the proportion of Immigrants from Laos and poverty level among single males in the United States with a correlation coefficient (R) of 0.571 and weighted average of 13.0%, a difference of 0.91%.
Single Male Poverty Correlation Summary
| Measurement | Scandinavian | Immigrants from Laos |
| Minimum | 5.2% | 5.2% |
| Maximum | 100.0% | 50.0% |
| Range | 94.8% | 44.8% |
| Mean | 37.9% | 17.5% |
| Median | 25.7% | 14.8% |
| Interquartile 25% (IQ1) | 14.5% | 12.4% |
| Interquartile 75% (IQ3) | 39.3% | 19.9% |
| Interquartile Range (IQR) | 24.8% | 7.5% |
| Standard Deviation (Sample) | 33.3% | 9.0% |
| Standard Deviation (Population) | 32.8% | 8.9% |
Similar Demographics by Single Male Poverty
Demographics Similar to Scandinavians by Single Male Poverty
In terms of single male poverty, the demographic groups most similar to Scandinavians are Bermudan (13.1%, a difference of 0.020%), Immigrants from Burma/Myanmar (13.1%, a difference of 0.030%), Austrian (13.1%, a difference of 0.11%), Japanese (13.1%, a difference of 0.21%), and Zimbabwean (13.1%, a difference of 0.22%).
| Demographics | Rating | Rank | Single Male Poverty |
| Swedes | 16.8 /100 | #211 | Poor 13.1% |
| Senegalese | 16.4 /100 | #212 | Poor 13.1% |
| Italians | 15.9 /100 | #213 | Poor 13.1% |
| Zimbabweans | 14.9 /100 | #214 | Poor 13.1% |
| Japanese | 14.8 /100 | #215 | Poor 13.1% |
| Austrians | 13.9 /100 | #216 | Poor 13.1% |
| Bermudans | 13.0 /100 | #217 | Poor 13.1% |
| Scandinavians | 12.9 /100 | #218 | Poor 13.1% |
| Immigrants | Burma/Myanmar | 12.6 /100 | #219 | Poor 13.1% |
| Central Americans | 10.9 /100 | #220 | Poor 13.2% |
| New Zealanders | 10.7 /100 | #221 | Poor 13.2% |
| Immigrants | Western Europe | 10.0 /100 | #222 | Poor 13.2% |
| Immigrants | Azores | 9.3 /100 | #223 | Tragic 13.2% |
| Somalis | 9.1 /100 | #224 | Tragic 13.2% |
| Immigrants | Denmark | 8.7 /100 | #225 | Tragic 13.2% |
Demographics Similar to Immigrants from Laos by Single Male Poverty
In terms of single male poverty, the demographic groups most similar to Immigrants from Laos are Immigrants from Grenada (13.0%, a difference of 0.0%), Immigrants from England (13.0%, a difference of 0.020%), Lithuanian (13.0%, a difference of 0.070%), Immigrants from Norway (13.0%, a difference of 0.10%), and Slovene (13.0%, a difference of 0.11%).
| Demographics | Rating | Rank | Single Male Poverty |
| Arabs | 27.0 /100 | #190 | Fair 13.0% |
| Immigrants | Thailand | 26.6 /100 | #191 | Fair 13.0% |
| Immigrants | Jamaica | 26.5 /100 | #192 | Fair 13.0% |
| Immigrants | South Africa | 26.1 /100 | #193 | Fair 13.0% |
| Liberians | 25.2 /100 | #194 | Fair 13.0% |
| Immigrants | England | 23.4 /100 | #195 | Fair 13.0% |
| Immigrants | Grenada | 23.1 /100 | #196 | Fair 13.0% |
| Immigrants | Laos | 23.1 /100 | #197 | Fair 13.0% |
| Lithuanians | 22.1 /100 | #198 | Fair 13.0% |
| Immigrants | Norway | 21.8 /100 | #199 | Fair 13.0% |
| Slovenes | 21.6 /100 | #200 | Fair 13.0% |
| Trinidadians and Tobagonians | 21.4 /100 | #201 | Fair 13.0% |
| Basques | 20.7 /100 | #202 | Fair 13.0% |
| Immigrants | Bangladesh | 20.4 /100 | #203 | Fair 13.0% |
| Estonians | 20.3 /100 | #204 | Fair 13.0% |