Portuguese vs Immigrants from France Single Male Poverty
COMPARE
Portuguese
Immigrants from France
Single Male Poverty
Single Male Poverty Comparison
Portuguese
Immigrants from France
12.9%
SINGLE MALE POVERTY
30.2/ 100
METRIC RATING
189th/ 347
METRIC RANK
12.6%
SINGLE MALE POVERTY
75.8/ 100
METRIC RATING
143rd/ 347
METRIC RANK
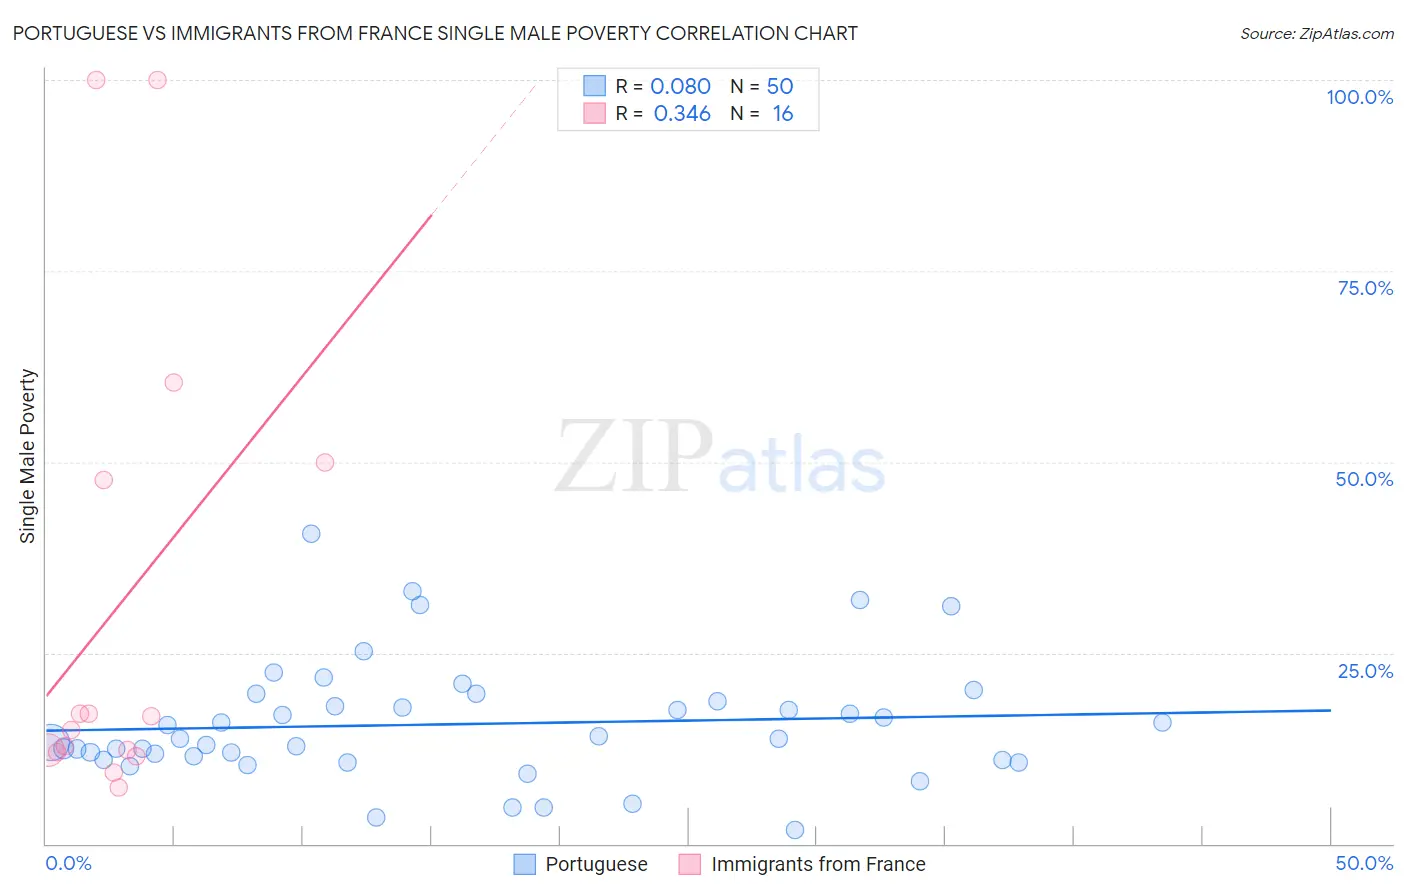
Portuguese vs Immigrants from France Single Male Poverty Correlation Chart
The statistical analysis conducted on geographies consisting of 390,984,789 people shows a slight positive correlation between the proportion of Portuguese and poverty level among single males in the United States with a correlation coefficient (R) of 0.080 and weighted average of 12.9%. Similarly, the statistical analysis conducted on geographies consisting of 259,237,479 people shows a mild positive correlation between the proportion of Immigrants from France and poverty level among single males in the United States with a correlation coefficient (R) of 0.346 and weighted average of 12.6%, a difference of 2.6%.
Single Male Poverty Correlation Summary
| Measurement | Portuguese | Immigrants from France |
| Minimum | 1.7% | 7.4% |
| Maximum | 40.6% | 100.0% |
| Range | 38.8% | 92.6% |
| Mean | 15.7% | 31.3% |
| Median | 13.7% | 15.8% |
| Interquartile 25% (IQ1) | 11.0% | 12.1% |
| Interquartile 75% (IQ3) | 18.7% | 48.8% |
| Interquartile Range (IQR) | 7.7% | 36.7% |
| Standard Deviation (Sample) | 7.9% | 31.3% |
| Standard Deviation (Population) | 7.8% | 30.3% |
Similar Demographics by Single Male Poverty
Demographics Similar to Portuguese by Single Male Poverty
In terms of single male poverty, the demographic groups most similar to Portuguese are Macedonian (12.9%, a difference of 0.080%), Nigerian (12.9%, a difference of 0.10%), Immigrants from Kuwait (12.9%, a difference of 0.10%), Norwegian (12.9%, a difference of 0.11%), and Immigrants from Trinidad and Tobago (12.9%, a difference of 0.14%).
| Demographics | Rating | Rank | Single Male Poverty |
| Moroccans | 36.8 /100 | #182 | Fair 12.9% |
| Immigrants | West Indies | 33.0 /100 | #183 | Fair 12.9% |
| Immigrants | Trinidad and Tobago | 32.5 /100 | #184 | Fair 12.9% |
| Norwegians | 32.0 /100 | #185 | Fair 12.9% |
| Nigerians | 31.9 /100 | #186 | Fair 12.9% |
| Immigrants | Kuwait | 31.9 /100 | #187 | Fair 12.9% |
| Macedonians | 31.5 /100 | #188 | Fair 12.9% |
| Portuguese | 30.2 /100 | #189 | Fair 12.9% |
| Arabs | 27.0 /100 | #190 | Fair 13.0% |
| Immigrants | Thailand | 26.6 /100 | #191 | Fair 13.0% |
| Immigrants | Jamaica | 26.5 /100 | #192 | Fair 13.0% |
| Immigrants | South Africa | 26.1 /100 | #193 | Fair 13.0% |
| Liberians | 25.2 /100 | #194 | Fair 13.0% |
| Immigrants | England | 23.4 /100 | #195 | Fair 13.0% |
| Immigrants | Grenada | 23.1 /100 | #196 | Fair 13.0% |
Demographics Similar to Immigrants from France by Single Male Poverty
In terms of single male poverty, the demographic groups most similar to Immigrants from France are Okinawan (12.6%, a difference of 0.010%), Immigrants from Uganda (12.6%, a difference of 0.010%), Hawaiian (12.6%, a difference of 0.050%), Immigrants from Lebanon (12.6%, a difference of 0.060%), and Native Hawaiian (12.6%, a difference of 0.060%).
| Demographics | Rating | Rank | Single Male Poverty |
| Immigrants | Austria | 81.9 /100 | #136 | Excellent 12.5% |
| Ukrainians | 80.7 /100 | #137 | Excellent 12.6% |
| Immigrants | El Salvador | 80.0 /100 | #138 | Excellent 12.6% |
| Cubans | 79.9 /100 | #139 | Good 12.6% |
| Immigrants | Zimbabwe | 78.0 /100 | #140 | Good 12.6% |
| Okinawans | 75.9 /100 | #141 | Good 12.6% |
| Immigrants | Uganda | 75.9 /100 | #142 | Good 12.6% |
| Immigrants | France | 75.8 /100 | #143 | Good 12.6% |
| Hawaiians | 75.1 /100 | #144 | Good 12.6% |
| Immigrants | Lebanon | 75.0 /100 | #145 | Good 12.6% |
| Native Hawaiians | 75.0 /100 | #146 | Good 12.6% |
| Malaysians | 74.8 /100 | #147 | Good 12.6% |
| Yugoslavians | 73.9 /100 | #148 | Good 12.6% |
| Sierra Leoneans | 73.0 /100 | #149 | Good 12.6% |
| Immigrants | Panama | 72.1 /100 | #150 | Good 12.6% |