European vs Immigrants from France Single Male Poverty
COMPARE
European
Immigrants from France
Single Male Poverty
Single Male Poverty Comparison
Europeans
Immigrants from France
13.3%
SINGLE MALE POVERTY
6.2/ 100
METRIC RATING
229th/ 347
METRIC RANK
12.6%
SINGLE MALE POVERTY
75.8/ 100
METRIC RATING
143rd/ 347
METRIC RANK
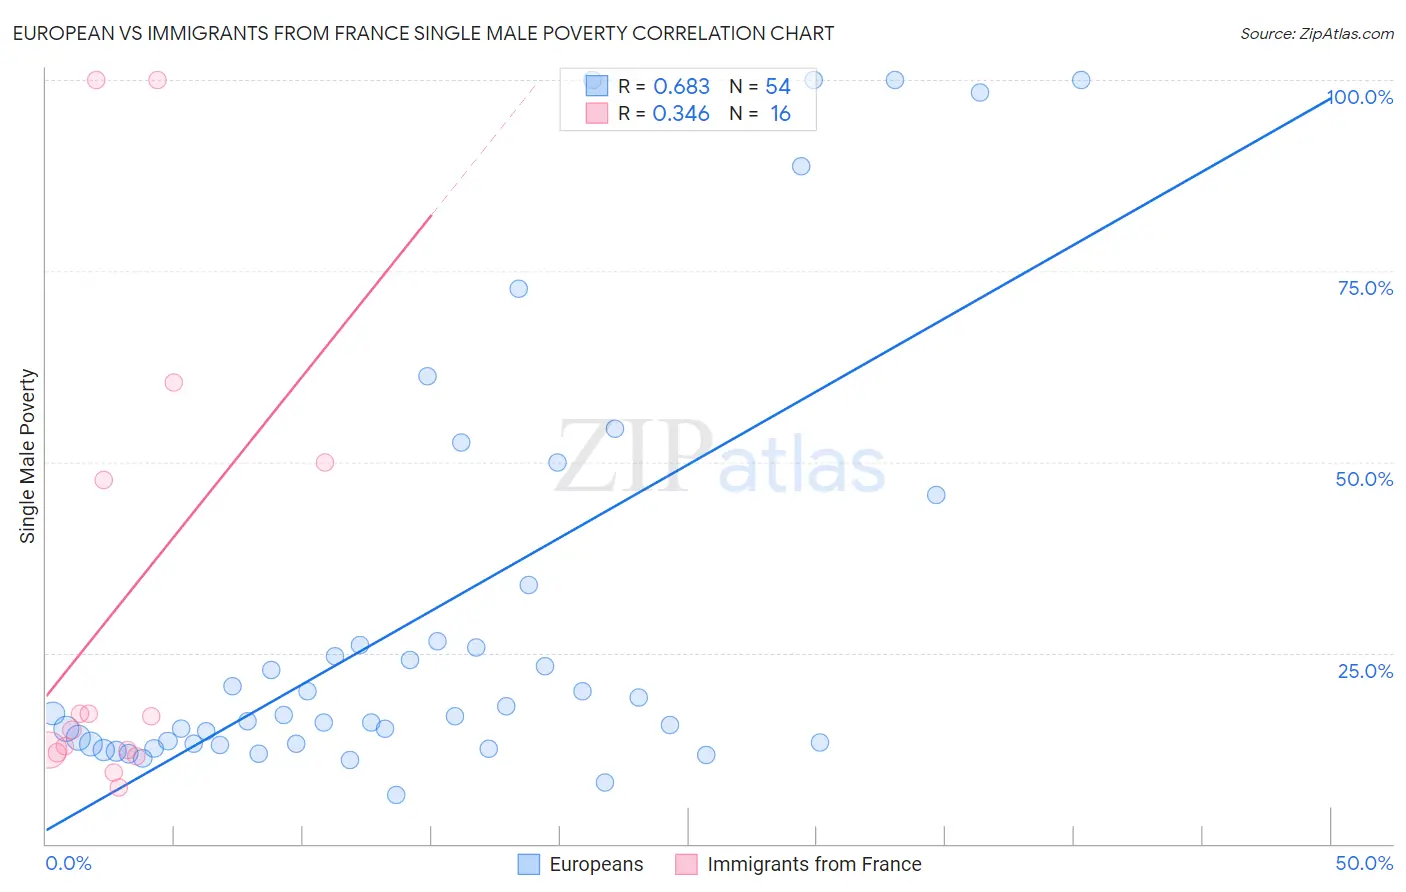
European vs Immigrants from France Single Male Poverty Correlation Chart
The statistical analysis conducted on geographies consisting of 466,343,596 people shows a significant positive correlation between the proportion of Europeans and poverty level among single males in the United States with a correlation coefficient (R) of 0.683 and weighted average of 13.3%. Similarly, the statistical analysis conducted on geographies consisting of 259,237,479 people shows a mild positive correlation between the proportion of Immigrants from France and poverty level among single males in the United States with a correlation coefficient (R) of 0.346 and weighted average of 12.6%, a difference of 5.2%.
Single Male Poverty Correlation Summary
| Measurement | European | Immigrants from France |
| Minimum | 6.4% | 7.4% |
| Maximum | 100.0% | 100.0% |
| Range | 93.6% | 92.6% |
| Mean | 29.9% | 31.3% |
| Median | 16.8% | 15.8% |
| Interquartile 25% (IQ1) | 13.1% | 12.1% |
| Interquartile 75% (IQ3) | 26.5% | 48.8% |
| Interquartile Range (IQR) | 13.3% | 36.7% |
| Standard Deviation (Sample) | 27.9% | 31.3% |
| Standard Deviation (Population) | 27.6% | 30.3% |
Similar Demographics by Single Male Poverty
Demographics Similar to Europeans by Single Male Poverty
In terms of single male poverty, the demographic groups most similar to Europeans are Ghanaian (13.3%, a difference of 0.030%), Lebanese (13.2%, a difference of 0.090%), Haitian (13.2%, a difference of 0.17%), Slavic (13.3%, a difference of 0.20%), and Immigrants from Caribbean (13.3%, a difference of 0.30%).
| Demographics | Rating | Rank | Single Male Poverty |
| Immigrants | Western Europe | 10.0 /100 | #222 | Poor 13.2% |
| Immigrants | Azores | 9.3 /100 | #223 | Tragic 13.2% |
| Somalis | 9.1 /100 | #224 | Tragic 13.2% |
| Immigrants | Denmark | 8.7 /100 | #225 | Tragic 13.2% |
| Jamaicans | 7.7 /100 | #226 | Tragic 13.2% |
| Haitians | 7.0 /100 | #227 | Tragic 13.2% |
| Lebanese | 6.6 /100 | #228 | Tragic 13.2% |
| Europeans | 6.2 /100 | #229 | Tragic 13.3% |
| Ghanaians | 6.1 /100 | #230 | Tragic 13.3% |
| Slavs | 5.3 /100 | #231 | Tragic 13.3% |
| Immigrants | Caribbean | 5.0 /100 | #232 | Tragic 13.3% |
| British | 4.0 /100 | #233 | Tragic 13.3% |
| Canadians | 4.0 /100 | #234 | Tragic 13.3% |
| Bangladeshis | 3.7 /100 | #235 | Tragic 13.3% |
| Luxembourgers | 3.6 /100 | #236 | Tragic 13.4% |
Demographics Similar to Immigrants from France by Single Male Poverty
In terms of single male poverty, the demographic groups most similar to Immigrants from France are Okinawan (12.6%, a difference of 0.010%), Immigrants from Uganda (12.6%, a difference of 0.010%), Hawaiian (12.6%, a difference of 0.050%), Immigrants from Lebanon (12.6%, a difference of 0.060%), and Native Hawaiian (12.6%, a difference of 0.060%).
| Demographics | Rating | Rank | Single Male Poverty |
| Immigrants | Austria | 81.9 /100 | #136 | Excellent 12.5% |
| Ukrainians | 80.7 /100 | #137 | Excellent 12.6% |
| Immigrants | El Salvador | 80.0 /100 | #138 | Excellent 12.6% |
| Cubans | 79.9 /100 | #139 | Good 12.6% |
| Immigrants | Zimbabwe | 78.0 /100 | #140 | Good 12.6% |
| Okinawans | 75.9 /100 | #141 | Good 12.6% |
| Immigrants | Uganda | 75.9 /100 | #142 | Good 12.6% |
| Immigrants | France | 75.8 /100 | #143 | Good 12.6% |
| Hawaiians | 75.1 /100 | #144 | Good 12.6% |
| Immigrants | Lebanon | 75.0 /100 | #145 | Good 12.6% |
| Native Hawaiians | 75.0 /100 | #146 | Good 12.6% |
| Malaysians | 74.8 /100 | #147 | Good 12.6% |
| Yugoslavians | 73.9 /100 | #148 | Good 12.6% |
| Sierra Leoneans | 73.0 /100 | #149 | Good 12.6% |
| Immigrants | Panama | 72.1 /100 | #150 | Good 12.6% |