Immigrants from Serbia vs Immigrants from Canada Family Poverty
COMPARE
Immigrants from Serbia
Immigrants from Canada
Family Poverty
Family Poverty Comparison
Immigrants from Serbia
Immigrants from Canada
7.7%
FAMILY POVERTY
98.7/ 100
METRIC RATING
56th/ 347
METRIC RANK
7.8%
FAMILY POVERTY
98.2/ 100
METRIC RATING
70th/ 347
METRIC RANK
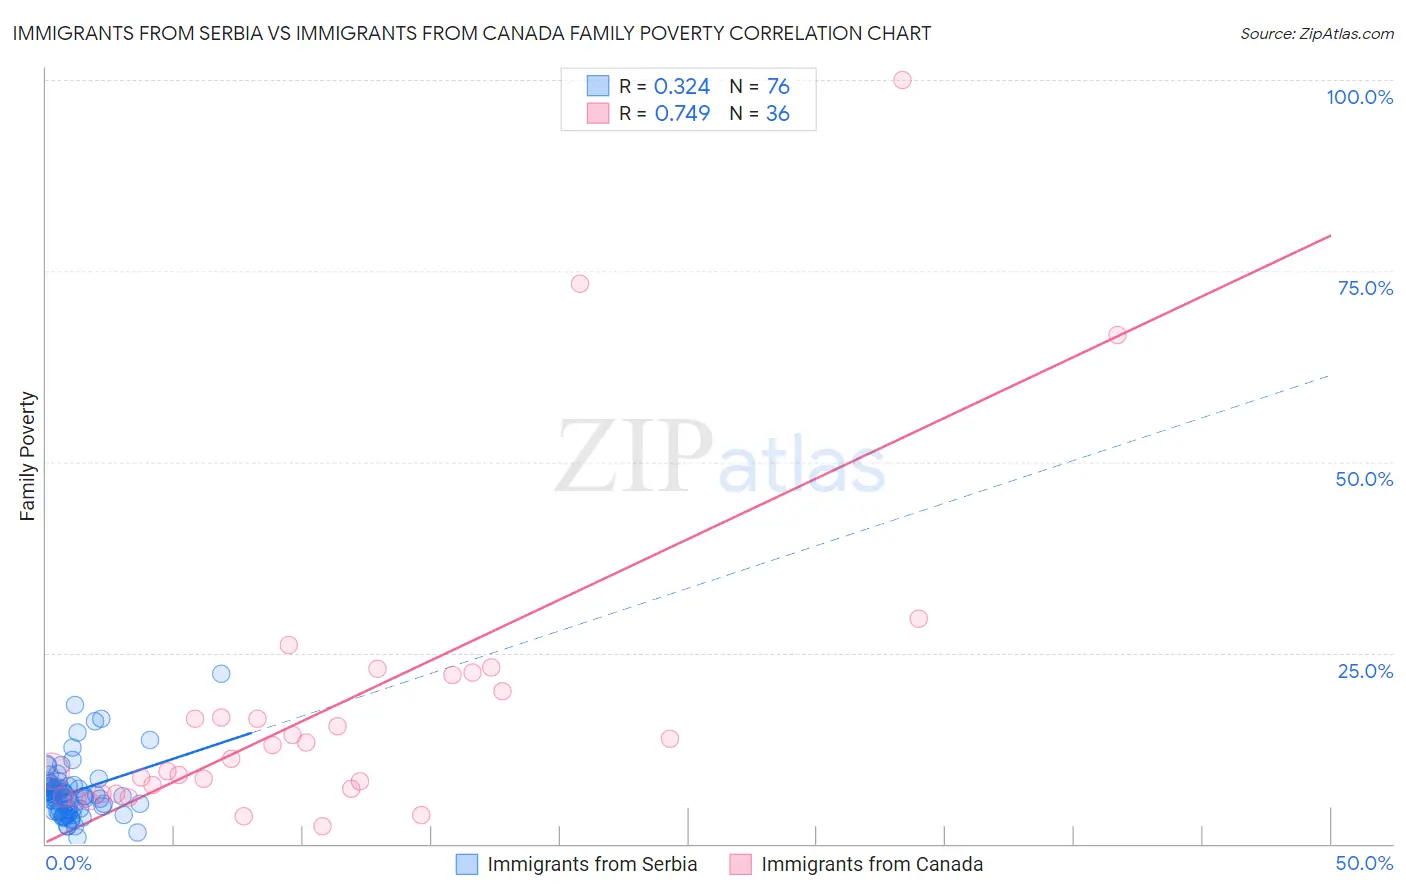
Immigrants from Serbia vs Immigrants from Canada Family Poverty Correlation Chart
The statistical analysis conducted on geographies consisting of 131,659,331 people shows a mild positive correlation between the proportion of Immigrants from Serbia and poverty level among families in the United States with a correlation coefficient (R) of 0.324 and weighted average of 7.7%. Similarly, the statistical analysis conducted on geographies consisting of 457,293,796 people shows a strong positive correlation between the proportion of Immigrants from Canada and poverty level among families in the United States with a correlation coefficient (R) of 0.749 and weighted average of 7.8%, a difference of 1.3%.
Family Poverty Correlation Summary
| Measurement | Immigrants from Serbia | Immigrants from Canada |
| Minimum | 0.76% | 2.3% |
| Maximum | 22.2% | 100.0% |
| Range | 21.5% | 97.7% |
| Mean | 6.8% | 18.1% |
| Median | 6.3% | 12.1% |
| Interquartile 25% (IQ1) | 4.3% | 6.9% |
| Interquartile 75% (IQ3) | 7.5% | 21.0% |
| Interquartile Range (IQR) | 3.2% | 14.2% |
| Standard Deviation (Sample) | 3.8% | 20.6% |
| Standard Deviation (Population) | 3.8% | 20.3% |
Demographics Similar to Immigrants from Serbia and Immigrants from Canada by Family Poverty
In terms of family poverty, the demographic groups most similar to Immigrants from Serbia are Immigrants from Eastern Asia (7.7%, a difference of 0.040%), Immigrants from Sweden (7.7%, a difference of 0.070%), Swiss (7.7%, a difference of 0.080%), Asian (7.7%, a difference of 0.090%), and Finnish (7.7%, a difference of 0.12%). Similarly, the demographic groups most similar to Immigrants from Canada are Cambodian (7.8%, a difference of 0.020%), Immigrants from Belgium (7.8%, a difference of 0.040%), Australian (7.8%, a difference of 0.060%), Immigrants from Romania (7.8%, a difference of 0.080%), and Austrian (7.8%, a difference of 0.080%).
| Demographics | Rating | Rank | Family Poverty |
| Swiss | 98.8 /100 | #53 | Exceptional 7.7% |
| Immigrants | Sweden | 98.8 /100 | #54 | Exceptional 7.7% |
| Immigrants | Eastern Asia | 98.7 /100 | #55 | Exceptional 7.7% |
| Immigrants | Serbia | 98.7 /100 | #56 | Exceptional 7.7% |
| Asians | 98.7 /100 | #57 | Exceptional 7.7% |
| Finns | 98.7 /100 | #58 | Exceptional 7.7% |
| Europeans | 98.7 /100 | #59 | Exceptional 7.7% |
| Immigrants | Greece | 98.7 /100 | #60 | Exceptional 7.7% |
| Immigrants | Netherlands | 98.6 /100 | #61 | Exceptional 7.7% |
| Macedonians | 98.6 /100 | #62 | Exceptional 7.8% |
| Zimbabweans | 98.4 /100 | #63 | Exceptional 7.8% |
| Koreans | 98.3 /100 | #64 | Exceptional 7.8% |
| Immigrants | Bulgaria | 98.3 /100 | #65 | Exceptional 7.8% |
| Dutch | 98.3 /100 | #66 | Exceptional 7.8% |
| Northern Europeans | 98.3 /100 | #67 | Exceptional 7.8% |
| Australians | 98.2 /100 | #68 | Exceptional 7.8% |
| Immigrants | Belgium | 98.2 /100 | #69 | Exceptional 7.8% |
| Immigrants | Canada | 98.2 /100 | #70 | Exceptional 7.8% |
| Cambodians | 98.2 /100 | #71 | Exceptional 7.8% |
| Immigrants | Romania | 98.2 /100 | #72 | Exceptional 7.8% |
| Austrians | 98.2 /100 | #73 | Exceptional 7.8% |