Scandinavian vs British West Indian Female Poverty Among 18-24 Year Olds
COMPARE
Scandinavian
British West Indian
Female Poverty Among 18-24 Year Olds
Female Poverty Among 18-24 Year Olds Comparison
Scandinavians
British West Indians
20.3%
FEMALE POVERTY AMONG 18-24 YEAR OLDS
34.6/ 100
METRIC RATING
188th/ 347
METRIC RANK
21.2%
FEMALE POVERTY AMONG 18-24 YEAR OLDS
1.2/ 100
METRIC RATING
254th/ 347
METRIC RANK
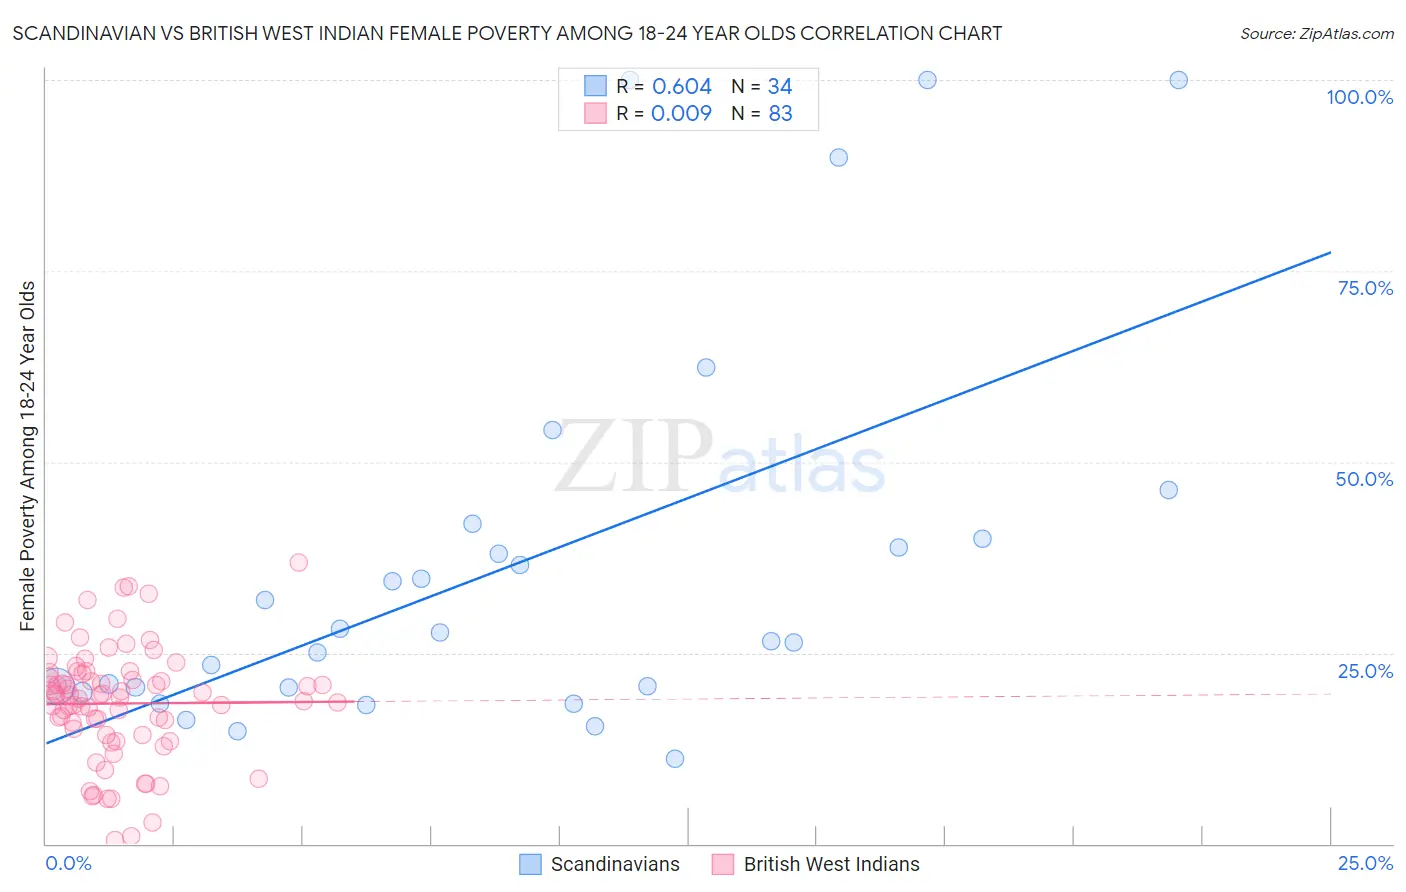
Scandinavian vs British West Indian Female Poverty Among 18-24 Year Olds Correlation Chart
The statistical analysis conducted on geographies consisting of 453,940,776 people shows a significant positive correlation between the proportion of Scandinavians and poverty level among females between the ages 18 and 24 in the United States with a correlation coefficient (R) of 0.604 and weighted average of 20.3%. Similarly, the statistical analysis conducted on geographies consisting of 151,313,646 people shows no correlation between the proportion of British West Indians and poverty level among females between the ages 18 and 24 in the United States with a correlation coefficient (R) of 0.009 and weighted average of 21.2%, a difference of 4.6%.
Female Poverty Among 18-24 Year Olds Correlation Summary
| Measurement | Scandinavian | British West Indian |
| Minimum | 11.1% | 0.52% |
| Maximum | 100.0% | 36.8% |
| Range | 88.9% | 36.3% |
| Mean | 36.5% | 18.4% |
| Median | 27.1% | 19.4% |
| Interquartile 25% (IQ1) | 20.4% | 14.3% |
| Interquartile 75% (IQ3) | 40.0% | 22.3% |
| Interquartile Range (IQR) | 19.5% | 8.1% |
| Standard Deviation (Sample) | 25.4% | 7.4% |
| Standard Deviation (Population) | 25.0% | 7.3% |
Similar Demographics by Female Poverty Among 18-24 Year Olds
Demographics Similar to Scandinavians by Female Poverty Among 18-24 Year Olds
In terms of female poverty among 18-24 year olds, the demographic groups most similar to Scandinavians are Immigrants from Germany (20.3%, a difference of 0.030%), Immigrants from Mexico (20.2%, a difference of 0.090%), Immigrants from Ethiopia (20.2%, a difference of 0.14%), Nepalese (20.2%, a difference of 0.27%), and Immigrants from Central America (20.2%, a difference of 0.28%).
| Demographics | Rating | Rank | Female Poverty Among 18-24 Year Olds |
| Immigrants | China | 43.0 /100 | #181 | Average 20.2% |
| Immigrants | Barbados | 42.8 /100 | #182 | Average 20.2% |
| Lebanese | 40.6 /100 | #183 | Average 20.2% |
| Immigrants | Central America | 39.9 /100 | #184 | Fair 20.2% |
| Nepalese | 39.7 /100 | #185 | Fair 20.2% |
| Immigrants | Ethiopia | 37.3 /100 | #186 | Fair 20.2% |
| Immigrants | Mexico | 36.3 /100 | #187 | Fair 20.2% |
| Scandinavians | 34.6 /100 | #188 | Fair 20.3% |
| Immigrants | Germany | 34.0 /100 | #189 | Fair 20.3% |
| Immigrants | Western Asia | 29.3 /100 | #190 | Fair 20.3% |
| Moroccans | 25.8 /100 | #191 | Fair 20.4% |
| Immigrants | Israel | 24.4 /100 | #192 | Fair 20.4% |
| Nigerians | 23.4 /100 | #193 | Fair 20.4% |
| Mexican American Indians | 23.2 /100 | #194 | Fair 20.4% |
| Immigrants | Latvia | 23.0 /100 | #195 | Fair 20.4% |
Demographics Similar to British West Indians by Female Poverty Among 18-24 Year Olds
In terms of female poverty among 18-24 year olds, the demographic groups most similar to British West Indians are Immigrants from Grenada (21.2%, a difference of 0.030%), Tsimshian (21.2%, a difference of 0.18%), Delaware (21.1%, a difference of 0.29%), Taiwanese (21.2%, a difference of 0.29%), and South African (21.1%, a difference of 0.33%).
| Demographics | Rating | Rank | Female Poverty Among 18-24 Year Olds |
| Immigrants | Africa | 3.0 /100 | #247 | Tragic 21.0% |
| Immigrants | Kenya | 2.5 /100 | #248 | Tragic 21.0% |
| Carpatho Rusyns | 2.5 /100 | #249 | Tragic 21.0% |
| Immigrants | West Indies | 2.2 /100 | #250 | Tragic 21.0% |
| West Indians | 1.9 /100 | #251 | Tragic 21.1% |
| South Africans | 1.6 /100 | #252 | Tragic 21.1% |
| Delaware | 1.6 /100 | #253 | Tragic 21.1% |
| British West Indians | 1.2 /100 | #254 | Tragic 21.2% |
| Immigrants | Grenada | 1.2 /100 | #255 | Tragic 21.2% |
| Tsimshian | 1.0 /100 | #256 | Tragic 21.2% |
| Taiwanese | 1.0 /100 | #257 | Tragic 21.2% |
| Vietnamese | 0.6 /100 | #258 | Tragic 21.4% |
| Immigrants | France | 0.6 /100 | #259 | Tragic 21.4% |
| Immigrants | Norway | 0.6 /100 | #260 | Tragic 21.4% |
| Immigrants | Bahamas | 0.5 /100 | #261 | Tragic 21.4% |