Samoan vs Immigrants from South Africa Male Poverty
COMPARE
Samoan
Immigrants from South Africa
Male Poverty
Male Poverty Comparison
Samoans
Immigrants from South Africa
10.9%
MALE POVERTY
71.8/ 100
METRIC RATING
144th/ 347
METRIC RANK
10.4%
MALE POVERTY
94.1/ 100
METRIC RATING
94th/ 347
METRIC RANK
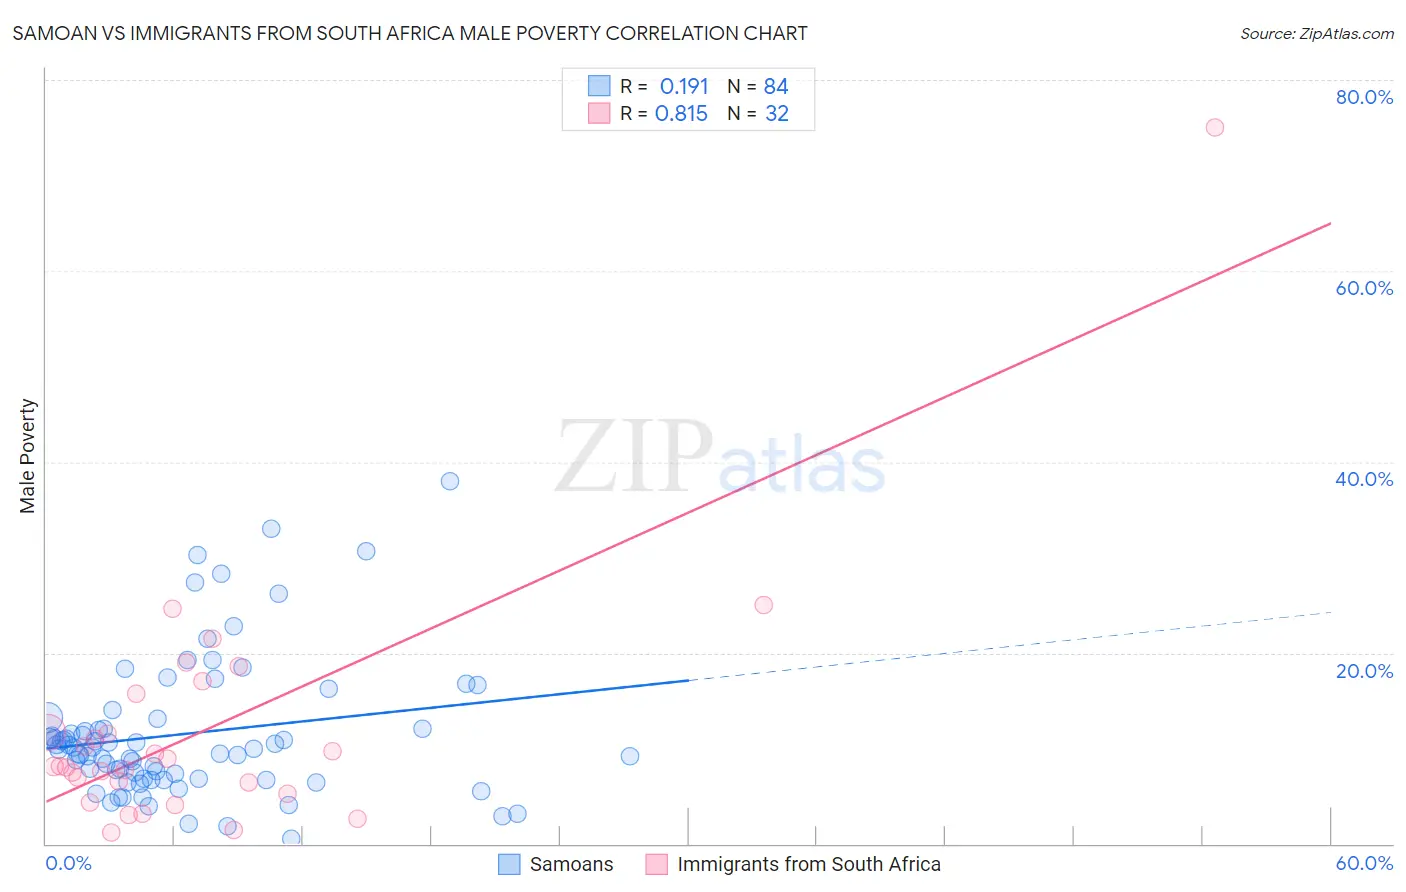
Samoan vs Immigrants from South Africa Male Poverty Correlation Chart
The statistical analysis conducted on geographies consisting of 225,058,260 people shows a poor positive correlation between the proportion of Samoans and poverty level among males in the United States with a correlation coefficient (R) of 0.191 and weighted average of 10.9%. Similarly, the statistical analysis conducted on geographies consisting of 233,179,579 people shows a very strong positive correlation between the proportion of Immigrants from South Africa and poverty level among males in the United States with a correlation coefficient (R) of 0.815 and weighted average of 10.4%, a difference of 4.8%.
Male Poverty Correlation Summary
| Measurement | Samoan | Immigrants from South Africa |
| Minimum | 0.57% | 1.1% |
| Maximum | 37.9% | 75.0% |
| Range | 37.3% | 73.9% |
| Mean | 11.5% | 11.9% |
| Median | 10.0% | 8.1% |
| Interquartile 25% (IQ1) | 6.8% | 5.8% |
| Interquartile 75% (IQ3) | 12.6% | 13.7% |
| Interquartile Range (IQR) | 5.8% | 7.8% |
| Standard Deviation (Sample) | 7.3% | 13.2% |
| Standard Deviation (Population) | 7.3% | 13.0% |
Similar Demographics by Male Poverty
Demographics Similar to Samoans by Male Poverty
In terms of male poverty, the demographic groups most similar to Samoans are Afghan (10.9%, a difference of 0.020%), Immigrants from Germany (10.9%, a difference of 0.020%), Syrian (10.9%, a difference of 0.050%), Basque (10.9%, a difference of 0.36%), and Icelander (11.0%, a difference of 0.39%).
| Demographics | Rating | Rank | Male Poverty |
| Immigrants | Switzerland | 79.2 /100 | #137 | Good 10.8% |
| Yugoslavians | 78.2 /100 | #138 | Good 10.8% |
| Immigrants | Jordan | 77.5 /100 | #139 | Good 10.8% |
| Tlingit-Haida | 76.1 /100 | #140 | Good 10.9% |
| Immigrants | France | 75.8 /100 | #141 | Good 10.9% |
| Basques | 74.6 /100 | #142 | Good 10.9% |
| Afghans | 71.9 /100 | #143 | Good 10.9% |
| Samoans | 71.8 /100 | #144 | Good 10.9% |
| Immigrants | Germany | 71.6 /100 | #145 | Good 10.9% |
| Syrians | 71.4 /100 | #146 | Good 10.9% |
| Icelanders | 68.5 /100 | #147 | Good 11.0% |
| Armenians | 68.0 /100 | #148 | Good 11.0% |
| Immigrants | Venezuela | 67.9 /100 | #149 | Good 11.0% |
| Guamanians/Chamorros | 67.6 /100 | #150 | Good 11.0% |
| Venezuelans | 67.4 /100 | #151 | Good 11.0% |
Demographics Similar to Immigrants from South Africa by Male Poverty
In terms of male poverty, the demographic groups most similar to Immigrants from South Africa are Scottish (10.4%, a difference of 0.030%), Immigrants from Egypt (10.4%, a difference of 0.16%), Jordanian (10.4%, a difference of 0.17%), Australian (10.4%, a difference of 0.17%), and Romanian (10.5%, a difference of 0.22%).
| Demographics | Rating | Rank | Male Poverty |
| Northern Europeans | 95.2 /100 | #87 | Exceptional 10.4% |
| Cambodians | 95.0 /100 | #88 | Exceptional 10.4% |
| Immigrants | Denmark | 95.0 /100 | #89 | Exceptional 10.4% |
| Indians (Asian) | 94.9 /100 | #90 | Exceptional 10.4% |
| British | 94.8 /100 | #91 | Exceptional 10.4% |
| Jordanians | 94.4 /100 | #92 | Exceptional 10.4% |
| Australians | 94.4 /100 | #93 | Exceptional 10.4% |
| Immigrants | South Africa | 94.1 /100 | #94 | Exceptional 10.4% |
| Scottish | 94.0 /100 | #95 | Exceptional 10.4% |
| Immigrants | Egypt | 93.7 /100 | #96 | Exceptional 10.4% |
| Romanians | 93.6 /100 | #97 | Exceptional 10.5% |
| Finns | 93.4 /100 | #98 | Exceptional 10.5% |
| Immigrants | Indonesia | 93.3 /100 | #99 | Exceptional 10.5% |
| Immigrants | Latvia | 92.8 /100 | #100 | Exceptional 10.5% |
| Immigrants | Zimbabwe | 92.0 /100 | #101 | Exceptional 10.5% |