Samoan vs South American Indian Male Poverty
COMPARE
Samoan
South American Indian
Male Poverty
Male Poverty Comparison
Samoans
South American Indians
10.9%
MALE POVERTY
71.8/ 100
METRIC RATING
144th/ 347
METRIC RANK
11.5%
MALE POVERTY
22.8/ 100
METRIC RATING
191st/ 347
METRIC RANK
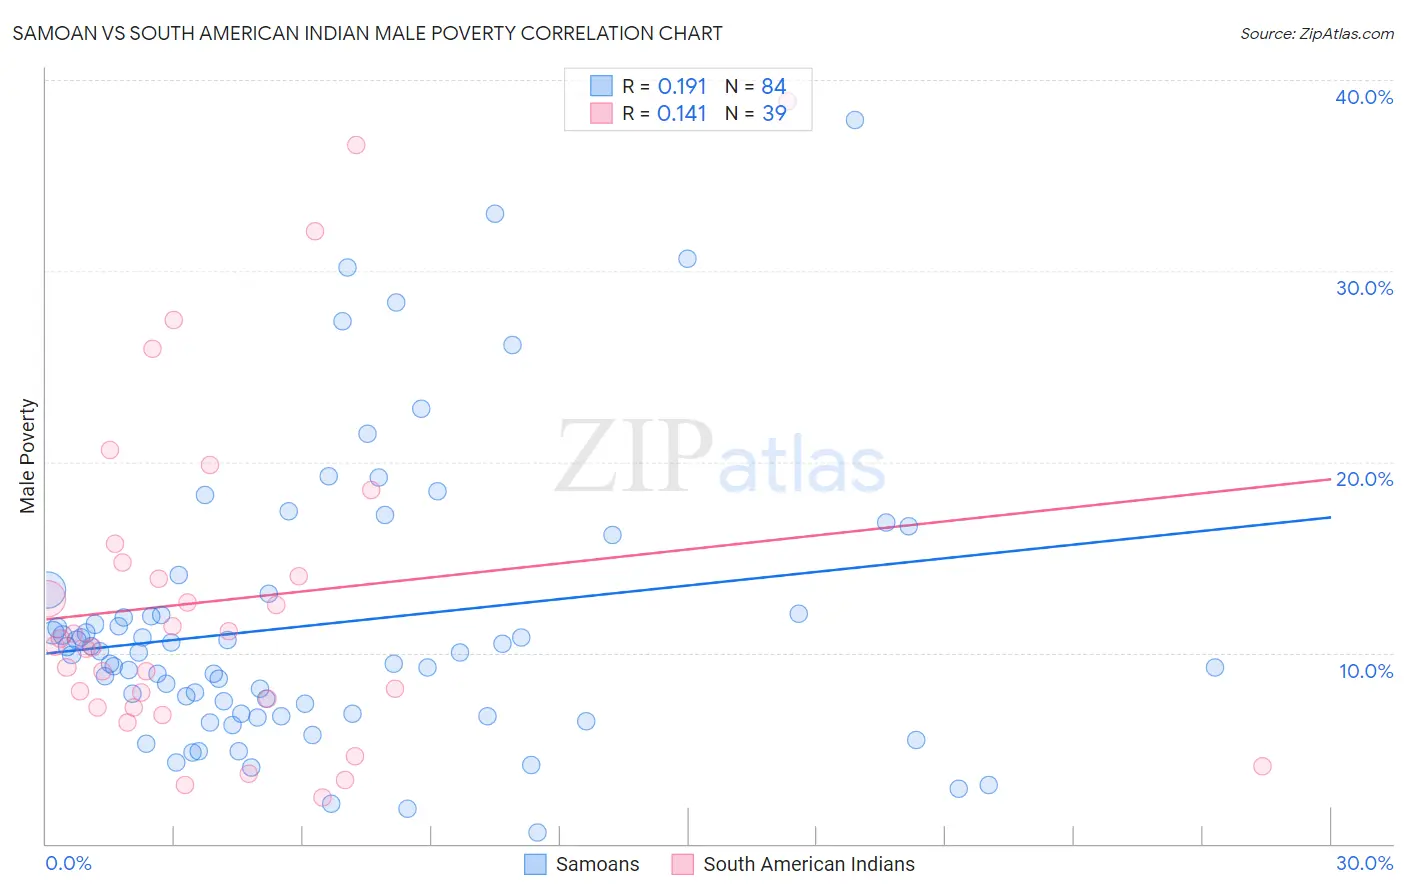
Samoan vs South American Indian Male Poverty Correlation Chart
The statistical analysis conducted on geographies consisting of 225,058,260 people shows a poor positive correlation between the proportion of Samoans and poverty level among males in the United States with a correlation coefficient (R) of 0.191 and weighted average of 10.9%. Similarly, the statistical analysis conducted on geographies consisting of 164,512,423 people shows a poor positive correlation between the proportion of South American Indians and poverty level among males in the United States with a correlation coefficient (R) of 0.141 and weighted average of 11.5%, a difference of 5.4%.
Male Poverty Correlation Summary
| Measurement | Samoan | South American Indian |
| Minimum | 0.57% | 2.4% |
| Maximum | 37.9% | 38.9% |
| Range | 37.3% | 36.5% |
| Mean | 11.5% | 12.8% |
| Median | 10.0% | 10.3% |
| Interquartile 25% (IQ1) | 6.8% | 7.1% |
| Interquartile 75% (IQ3) | 12.6% | 14.7% |
| Interquartile Range (IQR) | 5.8% | 7.6% |
| Standard Deviation (Sample) | 7.3% | 8.9% |
| Standard Deviation (Population) | 7.3% | 8.8% |
Similar Demographics by Male Poverty
Demographics Similar to Samoans by Male Poverty
In terms of male poverty, the demographic groups most similar to Samoans are Afghan (10.9%, a difference of 0.020%), Immigrants from Germany (10.9%, a difference of 0.020%), Syrian (10.9%, a difference of 0.050%), Basque (10.9%, a difference of 0.36%), and Icelander (11.0%, a difference of 0.39%).
| Demographics | Rating | Rank | Male Poverty |
| Immigrants | Switzerland | 79.2 /100 | #137 | Good 10.8% |
| Yugoslavians | 78.2 /100 | #138 | Good 10.8% |
| Immigrants | Jordan | 77.5 /100 | #139 | Good 10.8% |
| Tlingit-Haida | 76.1 /100 | #140 | Good 10.9% |
| Immigrants | France | 75.8 /100 | #141 | Good 10.9% |
| Basques | 74.6 /100 | #142 | Good 10.9% |
| Afghans | 71.9 /100 | #143 | Good 10.9% |
| Samoans | 71.8 /100 | #144 | Good 10.9% |
| Immigrants | Germany | 71.6 /100 | #145 | Good 10.9% |
| Syrians | 71.4 /100 | #146 | Good 10.9% |
| Icelanders | 68.5 /100 | #147 | Good 11.0% |
| Armenians | 68.0 /100 | #148 | Good 11.0% |
| Immigrants | Venezuela | 67.9 /100 | #149 | Good 11.0% |
| Guamanians/Chamorros | 67.6 /100 | #150 | Good 11.0% |
| Venezuelans | 67.4 /100 | #151 | Good 11.0% |
Demographics Similar to South American Indians by Male Poverty
In terms of male poverty, the demographic groups most similar to South American Indians are Israeli (11.5%, a difference of 0.43%), Immigrants from Uruguay (11.6%, a difference of 0.52%), Hawaiian (11.4%, a difference of 0.70%), Immigrants from Kuwait (11.6%, a difference of 0.81%), and Sierra Leonean (11.4%, a difference of 0.88%).
| Demographics | Rating | Rank | Male Poverty |
| Immigrants | South America | 36.9 /100 | #184 | Fair 11.3% |
| Immigrants | Afghanistan | 33.3 /100 | #185 | Fair 11.4% |
| Immigrants | Sierra Leone | 32.9 /100 | #186 | Fair 11.4% |
| Immigrants | Iraq | 31.9 /100 | #187 | Fair 11.4% |
| Sierra Leoneans | 29.9 /100 | #188 | Fair 11.4% |
| Hawaiians | 28.3 /100 | #189 | Fair 11.4% |
| Israelis | 26.1 /100 | #190 | Fair 11.5% |
| South American Indians | 22.8 /100 | #191 | Fair 11.5% |
| Immigrants | Uruguay | 19.1 /100 | #192 | Poor 11.6% |
| Immigrants | Kuwait | 17.3 /100 | #193 | Poor 11.6% |
| Immigrants | Kenya | 16.1 /100 | #194 | Poor 11.6% |
| Arabs | 15.8 /100 | #195 | Poor 11.6% |
| Hmong | 15.8 /100 | #196 | Poor 11.6% |
| Delaware | 15.4 /100 | #197 | Poor 11.7% |
| Iraqis | 14.7 /100 | #198 | Poor 11.7% |