Samoan vs Immigrants from Morocco Male Poverty
COMPARE
Samoan
Immigrants from Morocco
Male Poverty
Male Poverty Comparison
Samoans
Immigrants from Morocco
10.9%
MALE POVERTY
71.8/ 100
METRIC RATING
144th/ 347
METRIC RANK
11.3%
MALE POVERTY
40.1/ 100
METRIC RATING
180th/ 347
METRIC RANK
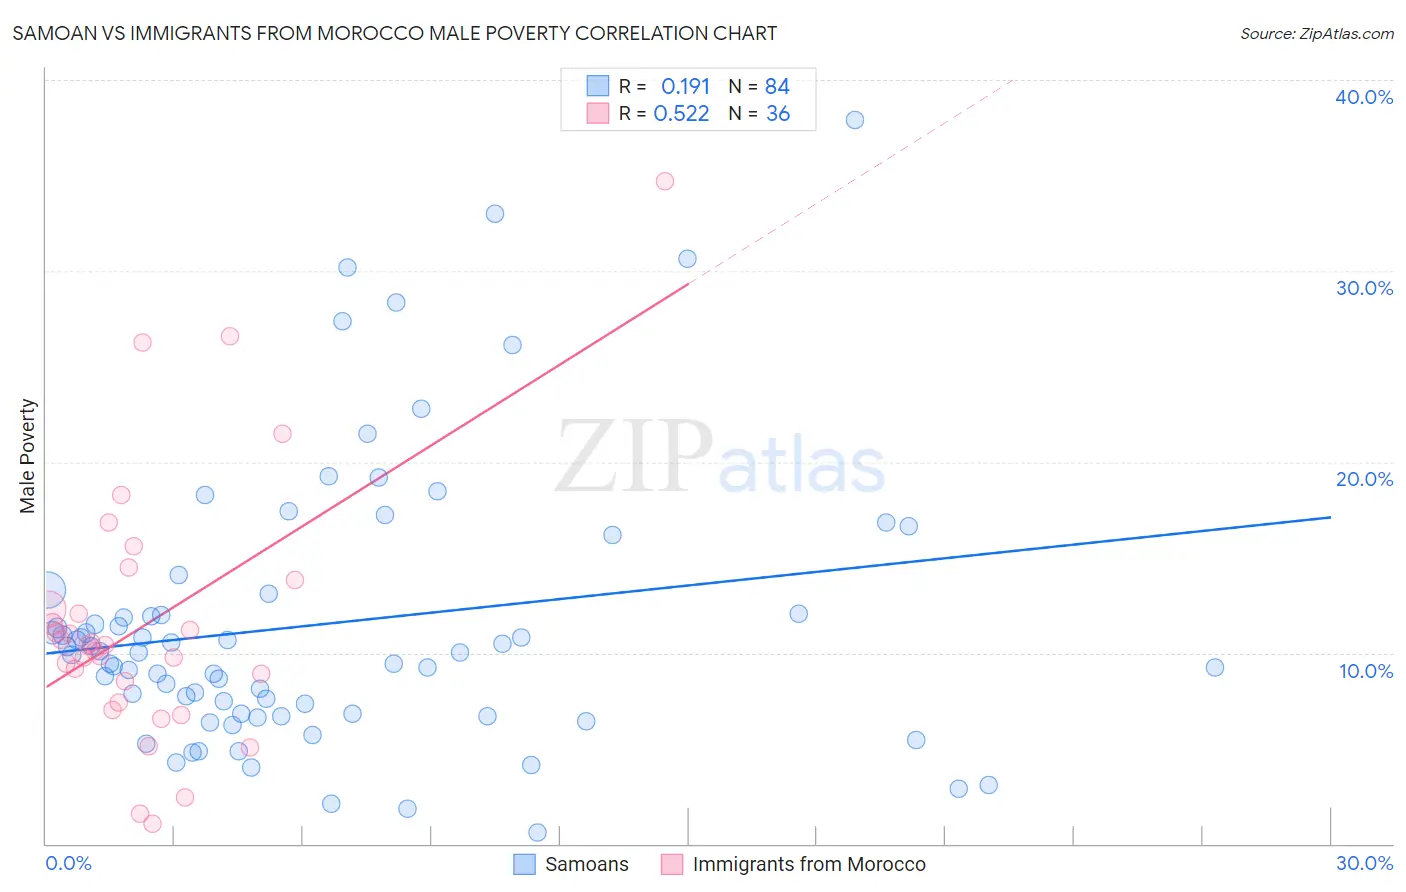
Samoan vs Immigrants from Morocco Male Poverty Correlation Chart
The statistical analysis conducted on geographies consisting of 225,058,260 people shows a poor positive correlation between the proportion of Samoans and poverty level among males in the United States with a correlation coefficient (R) of 0.191 and weighted average of 10.9%. Similarly, the statistical analysis conducted on geographies consisting of 178,894,090 people shows a substantial positive correlation between the proportion of Immigrants from Morocco and poverty level among males in the United States with a correlation coefficient (R) of 0.522 and weighted average of 11.3%, a difference of 3.3%.
Male Poverty Correlation Summary
| Measurement | Samoan | Immigrants from Morocco |
| Minimum | 0.57% | 1.1% |
| Maximum | 37.9% | 34.7% |
| Range | 37.3% | 33.6% |
| Mean | 11.5% | 11.6% |
| Median | 10.0% | 10.4% |
| Interquartile 25% (IQ1) | 6.8% | 8.0% |
| Interquartile 75% (IQ3) | 12.6% | 13.0% |
| Interquartile Range (IQR) | 5.8% | 5.1% |
| Standard Deviation (Sample) | 7.3% | 6.9% |
| Standard Deviation (Population) | 7.3% | 6.8% |
Similar Demographics by Male Poverty
Demographics Similar to Samoans by Male Poverty
In terms of male poverty, the demographic groups most similar to Samoans are Afghan (10.9%, a difference of 0.020%), Immigrants from Germany (10.9%, a difference of 0.020%), Syrian (10.9%, a difference of 0.050%), Basque (10.9%, a difference of 0.36%), and Icelander (11.0%, a difference of 0.39%).
| Demographics | Rating | Rank | Male Poverty |
| Immigrants | Switzerland | 79.2 /100 | #137 | Good 10.8% |
| Yugoslavians | 78.2 /100 | #138 | Good 10.8% |
| Immigrants | Jordan | 77.5 /100 | #139 | Good 10.8% |
| Tlingit-Haida | 76.1 /100 | #140 | Good 10.9% |
| Immigrants | France | 75.8 /100 | #141 | Good 10.9% |
| Basques | 74.6 /100 | #142 | Good 10.9% |
| Afghans | 71.9 /100 | #143 | Good 10.9% |
| Samoans | 71.8 /100 | #144 | Good 10.9% |
| Immigrants | Germany | 71.6 /100 | #145 | Good 10.9% |
| Syrians | 71.4 /100 | #146 | Good 10.9% |
| Icelanders | 68.5 /100 | #147 | Good 11.0% |
| Armenians | 68.0 /100 | #148 | Good 11.0% |
| Immigrants | Venezuela | 67.9 /100 | #149 | Good 11.0% |
| Guamanians/Chamorros | 67.6 /100 | #150 | Good 11.0% |
| Venezuelans | 67.4 /100 | #151 | Good 11.0% |
Demographics Similar to Immigrants from Morocco by Male Poverty
In terms of male poverty, the demographic groups most similar to Immigrants from Morocco are Immigrants from Syria (11.3%, a difference of 0.010%), Immigrants from Costa Rica (11.3%, a difference of 0.060%), Mongolian (11.3%, a difference of 0.11%), Kenyan (11.3%, a difference of 0.17%), and Immigrants from South America (11.3%, a difference of 0.33%).
| Demographics | Rating | Rank | Male Poverty |
| Pennsylvania Germans | 50.5 /100 | #173 | Average 11.2% |
| Immigrants | Oceania | 50.0 /100 | #174 | Average 11.2% |
| Celtics | 47.5 /100 | #175 | Average 11.2% |
| Immigrants | Fiji | 46.0 /100 | #176 | Average 11.2% |
| Lebanese | 45.6 /100 | #177 | Average 11.2% |
| Immigrants | Cameroon | 44.5 /100 | #178 | Average 11.2% |
| Immigrants | Syria | 40.3 /100 | #179 | Average 11.3% |
| Immigrants | Morocco | 40.1 /100 | #180 | Average 11.3% |
| Immigrants | Costa Rica | 39.5 /100 | #181 | Fair 11.3% |
| Mongolians | 39.0 /100 | #182 | Fair 11.3% |
| Kenyans | 38.4 /100 | #183 | Fair 11.3% |
| Immigrants | South America | 36.9 /100 | #184 | Fair 11.3% |
| Immigrants | Afghanistan | 33.3 /100 | #185 | Fair 11.4% |
| Immigrants | Sierra Leone | 32.9 /100 | #186 | Fair 11.4% |
| Immigrants | Iraq | 31.9 /100 | #187 | Fair 11.4% |