Immigrants from Ethiopia vs Immigrants from South Africa Male Poverty
COMPARE
Immigrants from Ethiopia
Immigrants from South Africa
Male Poverty
Male Poverty Comparison
Immigrants from Ethiopia
Immigrants from South Africa
11.2%
MALE POVERTY
50.7/ 100
METRIC RATING
172nd/ 347
METRIC RANK
10.4%
MALE POVERTY
94.1/ 100
METRIC RATING
94th/ 347
METRIC RANK
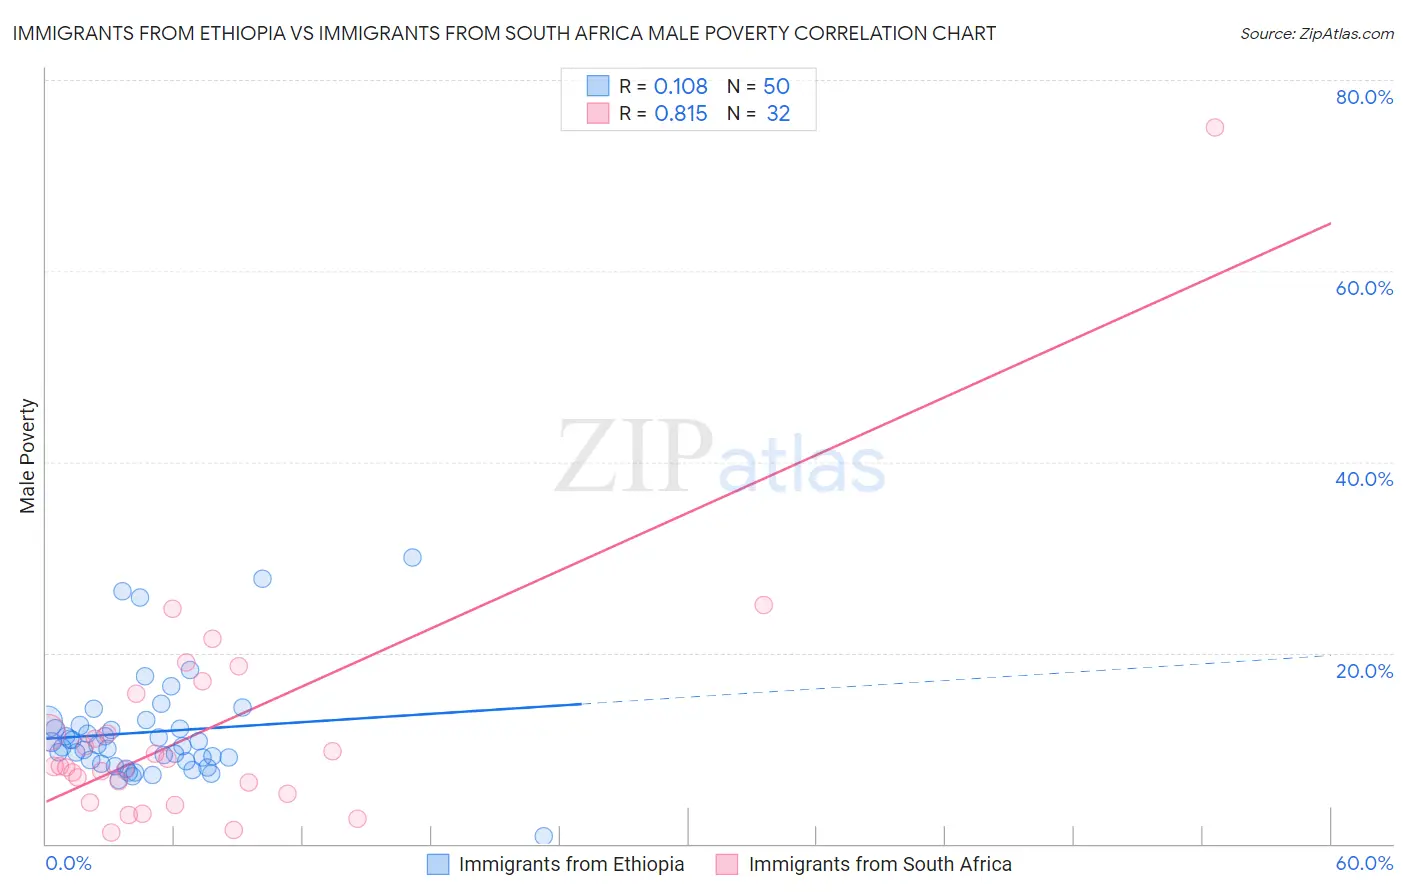
Immigrants from Ethiopia vs Immigrants from South Africa Male Poverty Correlation Chart
The statistical analysis conducted on geographies consisting of 211,452,093 people shows a poor positive correlation between the proportion of Immigrants from Ethiopia and poverty level among males in the United States with a correlation coefficient (R) of 0.108 and weighted average of 11.2%. Similarly, the statistical analysis conducted on geographies consisting of 233,179,579 people shows a very strong positive correlation between the proportion of Immigrants from South Africa and poverty level among males in the United States with a correlation coefficient (R) of 0.815 and weighted average of 10.4%, a difference of 7.2%.
Male Poverty Correlation Summary
| Measurement | Immigrants from Ethiopia | Immigrants from South Africa |
| Minimum | 0.81% | 1.1% |
| Maximum | 30.0% | 75.0% |
| Range | 29.2% | 73.9% |
| Mean | 11.7% | 11.9% |
| Median | 10.3% | 8.1% |
| Interquartile 25% (IQ1) | 8.7% | 5.8% |
| Interquartile 75% (IQ3) | 12.4% | 13.7% |
| Interquartile Range (IQR) | 3.7% | 7.8% |
| Standard Deviation (Sample) | 5.6% | 13.2% |
| Standard Deviation (Population) | 5.5% | 13.0% |
Similar Demographics by Male Poverty
Demographics Similar to Immigrants from Ethiopia by Male Poverty
In terms of male poverty, the demographic groups most similar to Immigrants from Ethiopia are Pennsylvania German (11.2%, a difference of 0.020%), Uruguayan (11.2%, a difference of 0.040%), Immigrants from Oceania (11.2%, a difference of 0.070%), South American (11.1%, a difference of 0.30%), and Celtic (11.2%, a difference of 0.32%).
| Demographics | Rating | Rank | Male Poverty |
| Immigrants | Spain | 55.5 /100 | #165 | Average 11.1% |
| Immigrants | Albania | 55.3 /100 | #166 | Average 11.1% |
| Hungarians | 55.1 /100 | #167 | Average 11.1% |
| Immigrants | Portugal | 54.9 /100 | #168 | Average 11.1% |
| Immigrants | Colombia | 54.2 /100 | #169 | Average 11.1% |
| South Americans | 53.8 /100 | #170 | Average 11.1% |
| Uruguayans | 51.0 /100 | #171 | Average 11.2% |
| Immigrants | Ethiopia | 50.7 /100 | #172 | Average 11.2% |
| Pennsylvania Germans | 50.5 /100 | #173 | Average 11.2% |
| Immigrants | Oceania | 50.0 /100 | #174 | Average 11.2% |
| Celtics | 47.5 /100 | #175 | Average 11.2% |
| Immigrants | Fiji | 46.0 /100 | #176 | Average 11.2% |
| Lebanese | 45.6 /100 | #177 | Average 11.2% |
| Immigrants | Cameroon | 44.5 /100 | #178 | Average 11.2% |
| Immigrants | Syria | 40.3 /100 | #179 | Average 11.3% |
Demographics Similar to Immigrants from South Africa by Male Poverty
In terms of male poverty, the demographic groups most similar to Immigrants from South Africa are Scottish (10.4%, a difference of 0.030%), Immigrants from Egypt (10.4%, a difference of 0.16%), Jordanian (10.4%, a difference of 0.17%), Australian (10.4%, a difference of 0.17%), and Romanian (10.5%, a difference of 0.22%).
| Demographics | Rating | Rank | Male Poverty |
| Northern Europeans | 95.2 /100 | #87 | Exceptional 10.4% |
| Cambodians | 95.0 /100 | #88 | Exceptional 10.4% |
| Immigrants | Denmark | 95.0 /100 | #89 | Exceptional 10.4% |
| Indians (Asian) | 94.9 /100 | #90 | Exceptional 10.4% |
| British | 94.8 /100 | #91 | Exceptional 10.4% |
| Jordanians | 94.4 /100 | #92 | Exceptional 10.4% |
| Australians | 94.4 /100 | #93 | Exceptional 10.4% |
| Immigrants | South Africa | 94.1 /100 | #94 | Exceptional 10.4% |
| Scottish | 94.0 /100 | #95 | Exceptional 10.4% |
| Immigrants | Egypt | 93.7 /100 | #96 | Exceptional 10.4% |
| Romanians | 93.6 /100 | #97 | Exceptional 10.5% |
| Finns | 93.4 /100 | #98 | Exceptional 10.5% |
| Immigrants | Indonesia | 93.3 /100 | #99 | Exceptional 10.5% |
| Immigrants | Latvia | 92.8 /100 | #100 | Exceptional 10.5% |
| Immigrants | Zimbabwe | 92.0 /100 | #101 | Exceptional 10.5% |