Samoan vs Immigrants from Ghana Male Poverty
COMPARE
Samoan
Immigrants from Ghana
Male Poverty
Male Poverty Comparison
Samoans
Immigrants from Ghana
10.9%
MALE POVERTY
71.8/ 100
METRIC RATING
144th/ 347
METRIC RANK
12.9%
MALE POVERTY
0.2/ 100
METRIC RATING
253rd/ 347
METRIC RANK
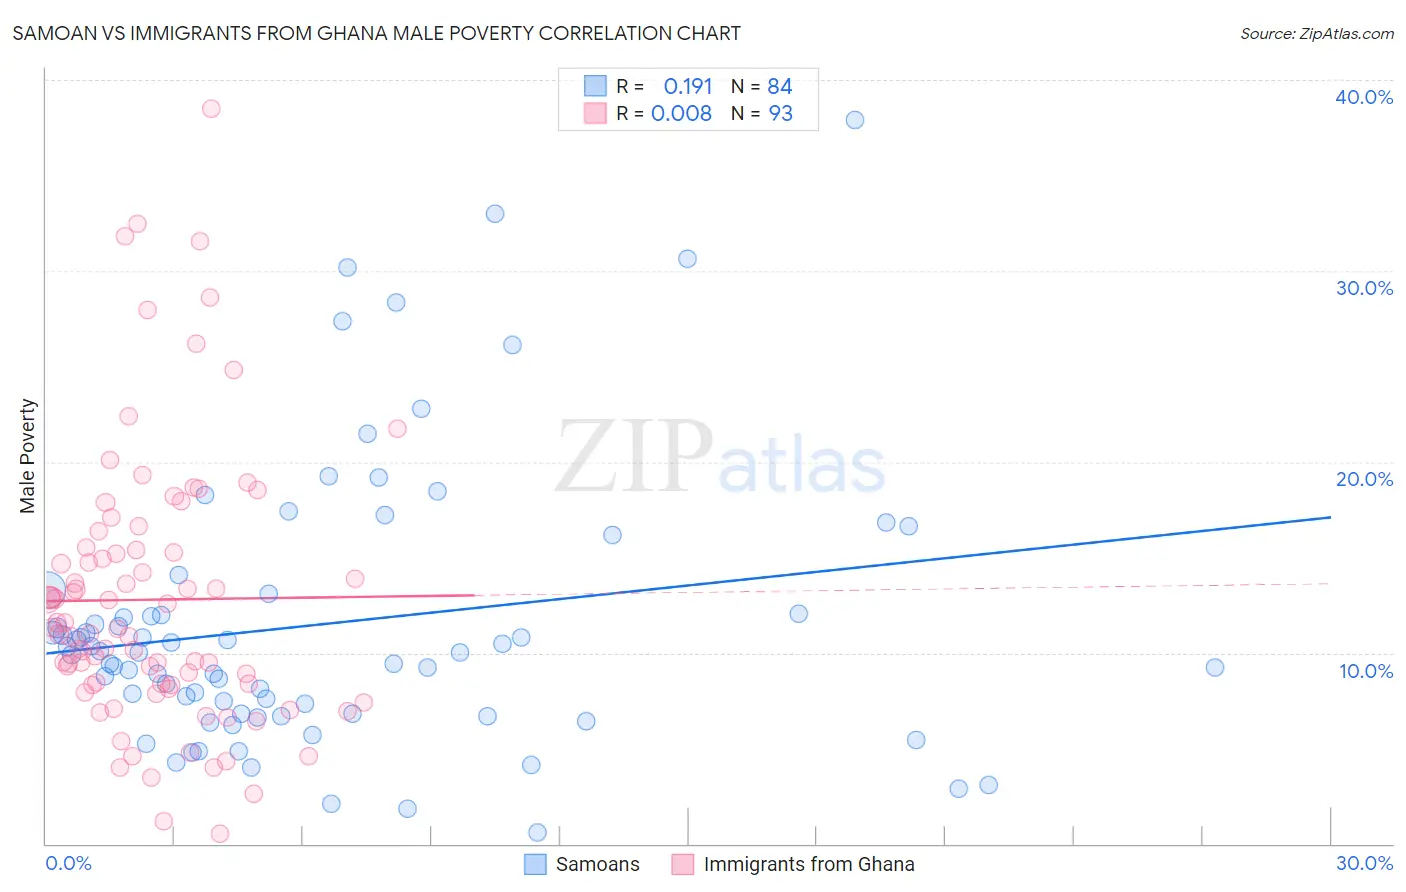
Samoan vs Immigrants from Ghana Male Poverty Correlation Chart
The statistical analysis conducted on geographies consisting of 225,058,260 people shows a poor positive correlation between the proportion of Samoans and poverty level among males in the United States with a correlation coefficient (R) of 0.191 and weighted average of 10.9%. Similarly, the statistical analysis conducted on geographies consisting of 199,744,013 people shows no correlation between the proportion of Immigrants from Ghana and poverty level among males in the United States with a correlation coefficient (R) of 0.008 and weighted average of 12.9%, a difference of 18.3%.
Male Poverty Correlation Summary
| Measurement | Samoan | Immigrants from Ghana |
| Minimum | 0.57% | 0.51% |
| Maximum | 37.9% | 38.5% |
| Range | 37.3% | 38.0% |
| Mean | 11.5% | 12.8% |
| Median | 10.0% | 11.3% |
| Interquartile 25% (IQ1) | 6.8% | 8.3% |
| Interquartile 75% (IQ3) | 12.6% | 15.5% |
| Interquartile Range (IQR) | 5.8% | 7.2% |
| Standard Deviation (Sample) | 7.3% | 7.2% |
| Standard Deviation (Population) | 7.3% | 7.1% |
Similar Demographics by Male Poverty
Demographics Similar to Samoans by Male Poverty
In terms of male poverty, the demographic groups most similar to Samoans are Afghan (10.9%, a difference of 0.020%), Immigrants from Germany (10.9%, a difference of 0.020%), Syrian (10.9%, a difference of 0.050%), Basque (10.9%, a difference of 0.36%), and Icelander (11.0%, a difference of 0.39%).
| Demographics | Rating | Rank | Male Poverty |
| Immigrants | Switzerland | 79.2 /100 | #137 | Good 10.8% |
| Yugoslavians | 78.2 /100 | #138 | Good 10.8% |
| Immigrants | Jordan | 77.5 /100 | #139 | Good 10.8% |
| Tlingit-Haida | 76.1 /100 | #140 | Good 10.9% |
| Immigrants | France | 75.8 /100 | #141 | Good 10.9% |
| Basques | 74.6 /100 | #142 | Good 10.9% |
| Afghans | 71.9 /100 | #143 | Good 10.9% |
| Samoans | 71.8 /100 | #144 | Good 10.9% |
| Immigrants | Germany | 71.6 /100 | #145 | Good 10.9% |
| Syrians | 71.4 /100 | #146 | Good 10.9% |
| Icelanders | 68.5 /100 | #147 | Good 11.0% |
| Armenians | 68.0 /100 | #148 | Good 11.0% |
| Immigrants | Venezuela | 67.9 /100 | #149 | Good 11.0% |
| Guamanians/Chamorros | 67.6 /100 | #150 | Good 11.0% |
| Venezuelans | 67.4 /100 | #151 | Good 11.0% |
Demographics Similar to Immigrants from Ghana by Male Poverty
In terms of male poverty, the demographic groups most similar to Immigrants from Ghana are Immigrants from Ecuador (12.9%, a difference of 0.050%), Immigrants from Cuba (12.9%, a difference of 0.080%), Immigrants from Nicaragua (12.9%, a difference of 0.18%), Potawatomi (12.9%, a difference of 0.19%), and Immigrants from Sudan (12.9%, a difference of 0.27%).
| Demographics | Rating | Rank | Male Poverty |
| Immigrants | El Salvador | 0.2 /100 | #246 | Tragic 12.8% |
| Immigrants | Western Africa | 0.2 /100 | #247 | Tragic 12.9% |
| Immigrants | Sudan | 0.2 /100 | #248 | Tragic 12.9% |
| Potawatomi | 0.2 /100 | #249 | Tragic 12.9% |
| Immigrants | Nicaragua | 0.2 /100 | #250 | Tragic 12.9% |
| Immigrants | Cuba | 0.2 /100 | #251 | Tragic 12.9% |
| Immigrants | Ecuador | 0.2 /100 | #252 | Tragic 12.9% |
| Immigrants | Ghana | 0.2 /100 | #253 | Tragic 12.9% |
| Mexican American Indians | 0.1 /100 | #254 | Tragic 13.0% |
| Immigrants | Liberia | 0.1 /100 | #255 | Tragic 13.0% |
| Immigrants | Burma/Myanmar | 0.1 /100 | #256 | Tragic 13.0% |
| Immigrants | Trinidad and Tobago | 0.1 /100 | #257 | Tragic 13.1% |
| Cape Verdeans | 0.1 /100 | #258 | Tragic 13.1% |
| Cherokee | 0.1 /100 | #259 | Tragic 13.1% |
| Ottawa | 0.1 /100 | #260 | Tragic 13.1% |