Ghanaian vs Immigrants from South Africa Male Poverty
COMPARE
Ghanaian
Immigrants from South Africa
Male Poverty
Male Poverty Comparison
Ghanaians
Immigrants from South Africa
12.7%
MALE POVERTY
0.4/ 100
METRIC RATING
239th/ 347
METRIC RANK
10.4%
MALE POVERTY
94.1/ 100
METRIC RATING
94th/ 347
METRIC RANK
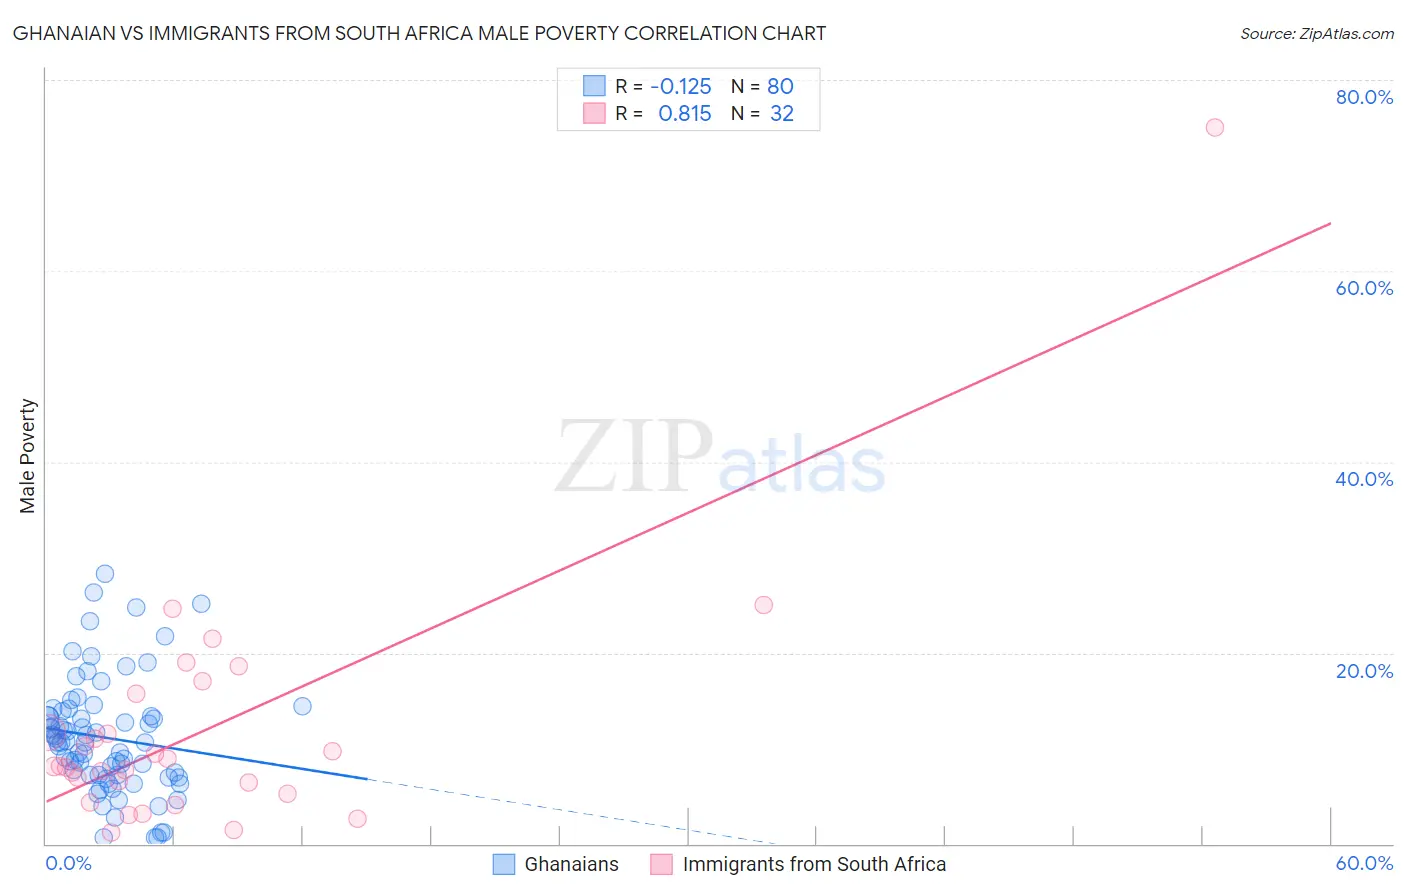
Ghanaian vs Immigrants from South Africa Male Poverty Correlation Chart
The statistical analysis conducted on geographies consisting of 190,493,527 people shows a poor negative correlation between the proportion of Ghanaians and poverty level among males in the United States with a correlation coefficient (R) of -0.125 and weighted average of 12.7%. Similarly, the statistical analysis conducted on geographies consisting of 233,179,579 people shows a very strong positive correlation between the proportion of Immigrants from South Africa and poverty level among males in the United States with a correlation coefficient (R) of 0.815 and weighted average of 10.4%, a difference of 21.6%.
Male Poverty Correlation Summary
| Measurement | Ghanaian | Immigrants from South Africa |
| Minimum | 0.62% | 1.1% |
| Maximum | 28.3% | 75.0% |
| Range | 27.6% | 73.9% |
| Mean | 11.1% | 11.9% |
| Median | 10.7% | 8.1% |
| Interquartile 25% (IQ1) | 7.2% | 5.8% |
| Interquartile 75% (IQ3) | 13.6% | 13.7% |
| Interquartile Range (IQR) | 6.5% | 7.8% |
| Standard Deviation (Sample) | 6.0% | 13.2% |
| Standard Deviation (Population) | 5.9% | 13.0% |
Similar Demographics by Male Poverty
Demographics Similar to Ghanaians by Male Poverty
In terms of male poverty, the demographic groups most similar to Ghanaians are Ecuadorian (12.7%, a difference of 0.0%), French American Indian (12.7%, a difference of 0.030%), Immigrants from Saudi Arabia (12.7%, a difference of 0.080%), Immigrants from Middle Africa (12.7%, a difference of 0.27%), and Immigrants from Laos (12.6%, a difference of 0.33%).
| Demographics | Rating | Rank | Male Poverty |
| Nicaraguans | 0.6 /100 | #232 | Tragic 12.6% |
| Fijians | 0.6 /100 | #233 | Tragic 12.6% |
| Immigrants | Armenia | 0.6 /100 | #234 | Tragic 12.6% |
| Immigrants | Laos | 0.5 /100 | #235 | Tragic 12.6% |
| Immigrants | Saudi Arabia | 0.4 /100 | #236 | Tragic 12.7% |
| French American Indians | 0.4 /100 | #237 | Tragic 12.7% |
| Ecuadorians | 0.4 /100 | #238 | Tragic 12.7% |
| Ghanaians | 0.4 /100 | #239 | Tragic 12.7% |
| Immigrants | Middle Africa | 0.4 /100 | #240 | Tragic 12.7% |
| Sudanese | 0.3 /100 | #241 | Tragic 12.8% |
| Nepalese | 0.3 /100 | #242 | Tragic 12.8% |
| Alaskan Athabascans | 0.3 /100 | #243 | Tragic 12.8% |
| Tsimshian | 0.3 /100 | #244 | Tragic 12.8% |
| Liberians | 0.3 /100 | #245 | Tragic 12.8% |
| Immigrants | El Salvador | 0.2 /100 | #246 | Tragic 12.8% |
Demographics Similar to Immigrants from South Africa by Male Poverty
In terms of male poverty, the demographic groups most similar to Immigrants from South Africa are Scottish (10.4%, a difference of 0.030%), Immigrants from Egypt (10.4%, a difference of 0.16%), Jordanian (10.4%, a difference of 0.17%), Australian (10.4%, a difference of 0.17%), and Romanian (10.5%, a difference of 0.22%).
| Demographics | Rating | Rank | Male Poverty |
| Northern Europeans | 95.2 /100 | #87 | Exceptional 10.4% |
| Cambodians | 95.0 /100 | #88 | Exceptional 10.4% |
| Immigrants | Denmark | 95.0 /100 | #89 | Exceptional 10.4% |
| Indians (Asian) | 94.9 /100 | #90 | Exceptional 10.4% |
| British | 94.8 /100 | #91 | Exceptional 10.4% |
| Jordanians | 94.4 /100 | #92 | Exceptional 10.4% |
| Australians | 94.4 /100 | #93 | Exceptional 10.4% |
| Immigrants | South Africa | 94.1 /100 | #94 | Exceptional 10.4% |
| Scottish | 94.0 /100 | #95 | Exceptional 10.4% |
| Immigrants | Egypt | 93.7 /100 | #96 | Exceptional 10.4% |
| Romanians | 93.6 /100 | #97 | Exceptional 10.5% |
| Finns | 93.4 /100 | #98 | Exceptional 10.5% |
| Immigrants | Indonesia | 93.3 /100 | #99 | Exceptional 10.5% |
| Immigrants | Latvia | 92.8 /100 | #100 | Exceptional 10.5% |
| Immigrants | Zimbabwe | 92.0 /100 | #101 | Exceptional 10.5% |