Nonimmigrants vs Immigrants from Morocco Male Poverty
COMPARE
Nonimmigrants
Immigrants from Morocco
Male Poverty
Male Poverty Comparison
Nonimmigrants
Immigrants from Morocco
12.1%
MALE POVERTY
3.1/ 100
METRIC RATING
213th/ 347
METRIC RANK
11.3%
MALE POVERTY
40.1/ 100
METRIC RATING
180th/ 347
METRIC RANK
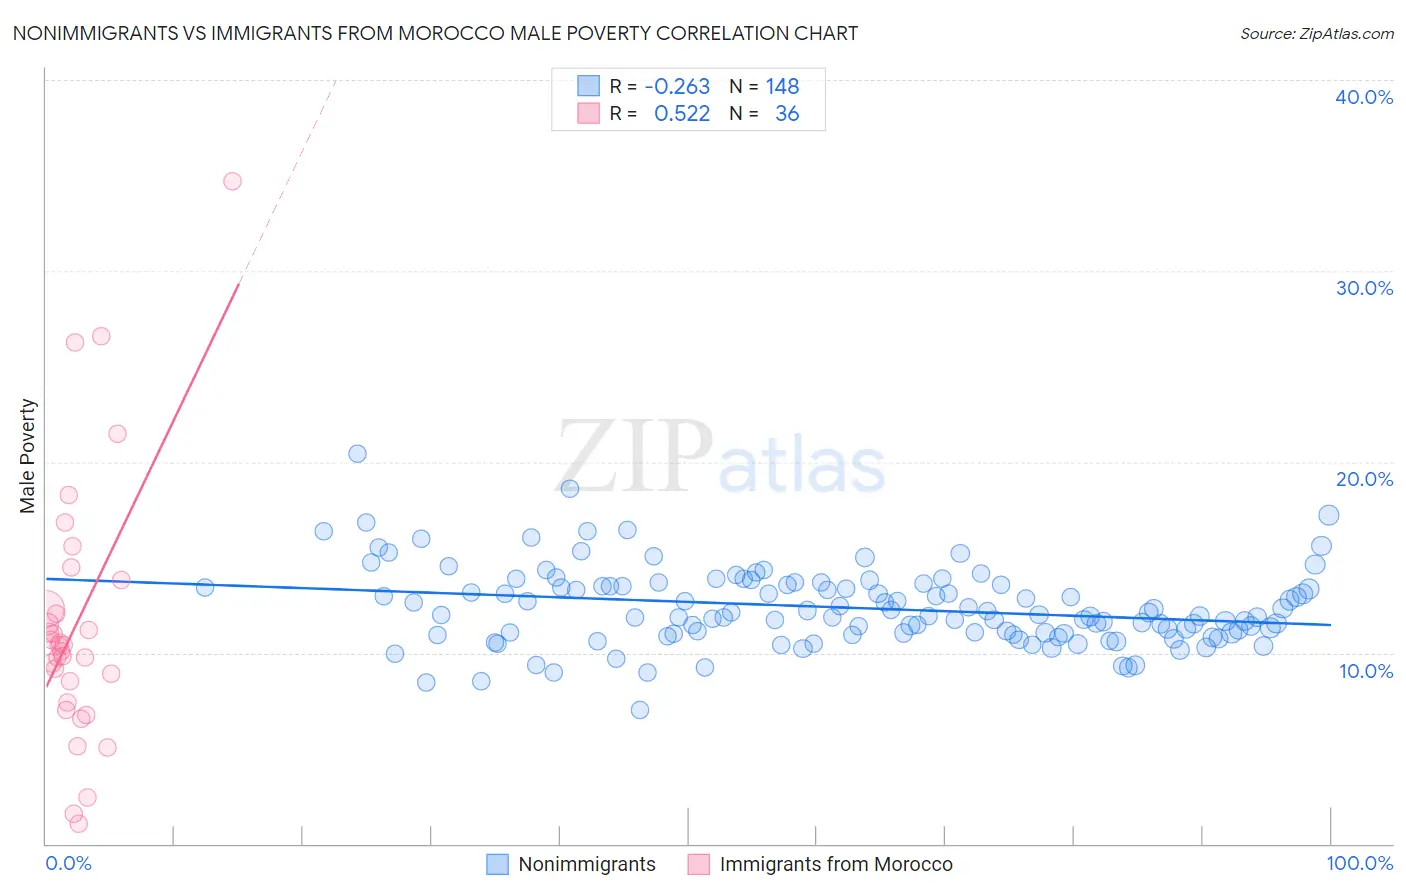
Nonimmigrants vs Immigrants from Morocco Male Poverty Correlation Chart
The statistical analysis conducted on geographies consisting of 582,696,583 people shows a weak negative correlation between the proportion of Nonimmigrants and poverty level among males in the United States with a correlation coefficient (R) of -0.263 and weighted average of 12.1%. Similarly, the statistical analysis conducted on geographies consisting of 178,894,090 people shows a substantial positive correlation between the proportion of Immigrants from Morocco and poverty level among males in the United States with a correlation coefficient (R) of 0.522 and weighted average of 11.3%, a difference of 7.4%.
Male Poverty Correlation Summary
| Measurement | Nonimmigrants | Immigrants from Morocco |
| Minimum | 7.0% | 1.1% |
| Maximum | 20.4% | 34.7% |
| Range | 13.4% | 33.6% |
| Mean | 12.4% | 11.6% |
| Median | 12.0% | 10.4% |
| Interquartile 25% (IQ1) | 11.0% | 8.0% |
| Interquartile 75% (IQ3) | 13.5% | 13.0% |
| Interquartile Range (IQR) | 2.5% | 5.1% |
| Standard Deviation (Sample) | 2.0% | 6.9% |
| Standard Deviation (Population) | 2.0% | 6.8% |
Similar Demographics by Male Poverty
Demographics Similar to Nonimmigrants by Male Poverty
In terms of male poverty, the demographic groups most similar to Nonimmigrants are American (12.1%, a difference of 0.040%), Japanese (12.2%, a difference of 0.32%), Immigrants from Uzbekistan (12.2%, a difference of 0.43%), Immigrants from Cambodia (12.2%, a difference of 0.51%), and Immigrants from Thailand (12.2%, a difference of 0.52%).
| Demographics | Rating | Rank | Male Poverty |
| Immigrants | Eastern Africa | 5.4 /100 | #206 | Tragic 12.0% |
| Malaysians | 5.2 /100 | #207 | Tragic 12.0% |
| Immigrants | Immigrants | 4.5 /100 | #208 | Tragic 12.0% |
| Immigrants | Azores | 4.3 /100 | #209 | Tragic 12.0% |
| Moroccans | 4.2 /100 | #210 | Tragic 12.0% |
| Immigrants | Panama | 4.0 /100 | #211 | Tragic 12.1% |
| Americans | 3.2 /100 | #212 | Tragic 12.1% |
| Immigrants | Nonimmigrants | 3.1 /100 | #213 | Tragic 12.1% |
| Japanese | 2.7 /100 | #214 | Tragic 12.2% |
| Immigrants | Uzbekistan | 2.6 /100 | #215 | Tragic 12.2% |
| Immigrants | Cambodia | 2.5 /100 | #216 | Tragic 12.2% |
| Immigrants | Thailand | 2.5 /100 | #217 | Tragic 12.2% |
| German Russians | 2.5 /100 | #218 | Tragic 12.2% |
| Bermudans | 2.4 /100 | #219 | Tragic 12.2% |
| Immigrants | Eritrea | 2.4 /100 | #220 | Tragic 12.2% |
Demographics Similar to Immigrants from Morocco by Male Poverty
In terms of male poverty, the demographic groups most similar to Immigrants from Morocco are Immigrants from Syria (11.3%, a difference of 0.010%), Immigrants from Costa Rica (11.3%, a difference of 0.060%), Mongolian (11.3%, a difference of 0.11%), Kenyan (11.3%, a difference of 0.17%), and Immigrants from South America (11.3%, a difference of 0.33%).
| Demographics | Rating | Rank | Male Poverty |
| Pennsylvania Germans | 50.5 /100 | #173 | Average 11.2% |
| Immigrants | Oceania | 50.0 /100 | #174 | Average 11.2% |
| Celtics | 47.5 /100 | #175 | Average 11.2% |
| Immigrants | Fiji | 46.0 /100 | #176 | Average 11.2% |
| Lebanese | 45.6 /100 | #177 | Average 11.2% |
| Immigrants | Cameroon | 44.5 /100 | #178 | Average 11.2% |
| Immigrants | Syria | 40.3 /100 | #179 | Average 11.3% |
| Immigrants | Morocco | 40.1 /100 | #180 | Average 11.3% |
| Immigrants | Costa Rica | 39.5 /100 | #181 | Fair 11.3% |
| Mongolians | 39.0 /100 | #182 | Fair 11.3% |
| Kenyans | 38.4 /100 | #183 | Fair 11.3% |
| Immigrants | South America | 36.9 /100 | #184 | Fair 11.3% |
| Immigrants | Afghanistan | 33.3 /100 | #185 | Fair 11.4% |
| Immigrants | Sierra Leone | 32.9 /100 | #186 | Fair 11.4% |
| Immigrants | Iraq | 31.9 /100 | #187 | Fair 11.4% |