Samoan vs Immigrants from Morocco Average Family Size
COMPARE
Samoan
Immigrants from Morocco
Average Family Size
Average Family Size Comparison
Samoans
Immigrants from Morocco
3.42
AVERAGE FAMILY SIZE
100.0/ 100
METRIC RATING
30th/ 347
METRIC RANK
3.21
AVERAGE FAMILY SIZE
18.5/ 100
METRIC RATING
201st/ 347
METRIC RANK
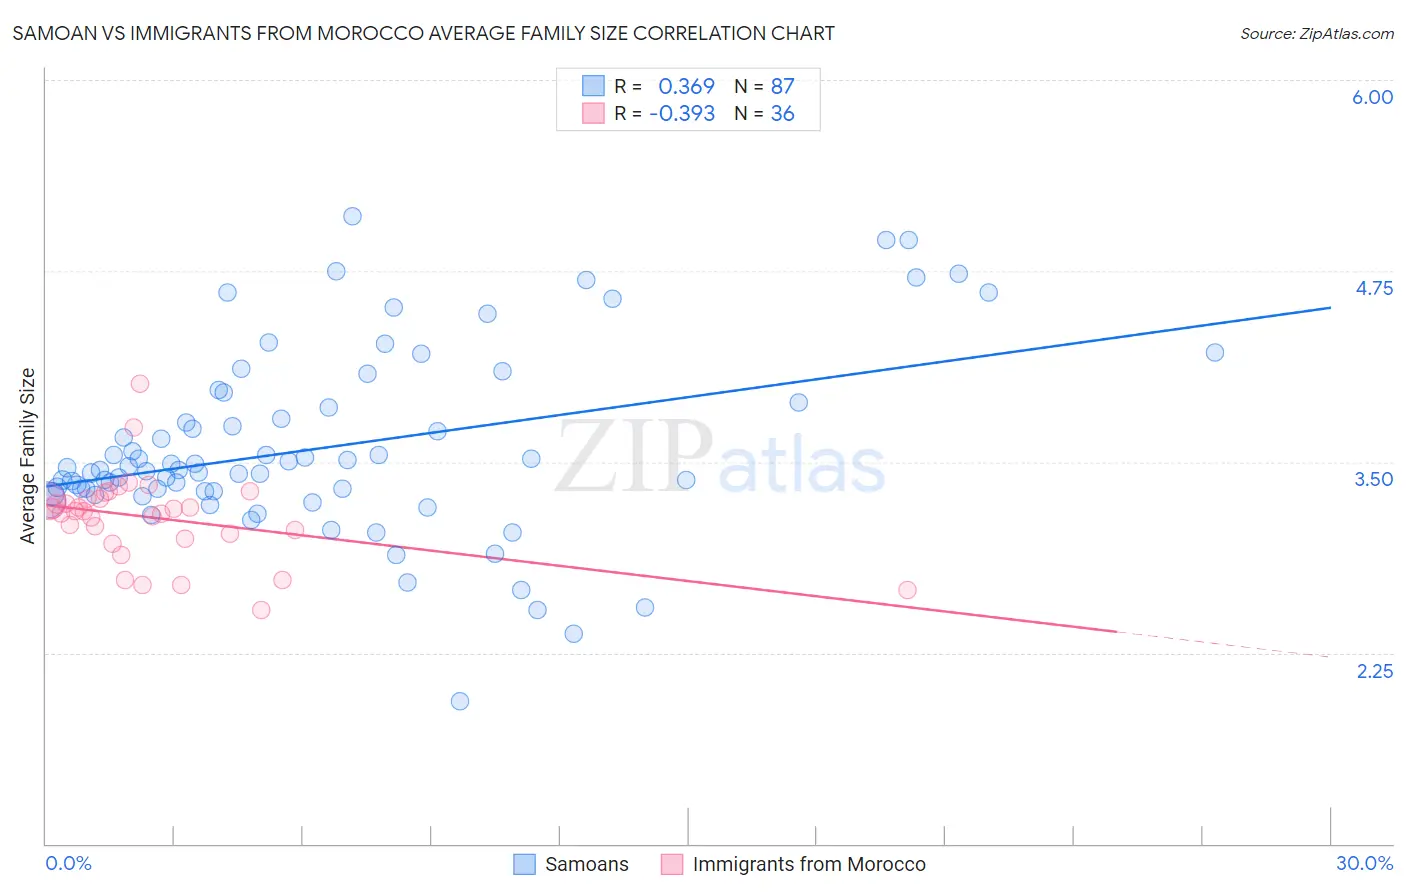
Samoan vs Immigrants from Morocco Average Family Size Correlation Chart
The statistical analysis conducted on geographies consisting of 225,071,591 people shows a mild positive correlation between the proportion of Samoans and average family size in the United States with a correlation coefficient (R) of 0.369 and weighted average of 3.42. Similarly, the statistical analysis conducted on geographies consisting of 178,909,598 people shows a mild negative correlation between the proportion of Immigrants from Morocco and average family size in the United States with a correlation coefficient (R) of -0.393 and weighted average of 3.21, a difference of 6.7%.
Average Family Size Correlation Summary
| Measurement | Samoan | Immigrants from Morocco |
| Minimum | 1.93 | 2.53 |
| Maximum | 5.11 | 4.01 |
| Range | 3.18 | 1.48 |
| Mean | 3.60 | 3.13 |
| Median | 3.45 | 3.18 |
| Interquartile 25% (IQ1) | 3.30 | 3.02 |
| Interquartile 75% (IQ3) | 3.89 | 3.26 |
| Interquartile Range (IQR) | 0.58 | 0.24 |
| Standard Deviation (Sample) | 0.60 | 0.29 |
| Standard Deviation (Population) | 0.60 | 0.28 |
Similar Demographics by Average Family Size
Demographics Similar to Samoans by Average Family Size
In terms of average family size, the demographic groups most similar to Samoans are Nepalese (3.42, a difference of 0.030%), Immigrants from Latin America (3.42, a difference of 0.12%), Central American (3.41, a difference of 0.20%), Mexican American Indian (3.43, a difference of 0.24%), and Native Hawaiian (3.43, a difference of 0.25%).
| Demographics | Rating | Rank | Average Family Size |
| Immigrants | Fiji | 100.0 /100 | #23 | Exceptional 3.45 |
| Natives/Alaskans | 100.0 /100 | #24 | Exceptional 3.45 |
| Yakama | 100.0 /100 | #25 | Exceptional 3.45 |
| Native Hawaiians | 100.0 /100 | #26 | Exceptional 3.43 |
| Mexican American Indians | 100.0 /100 | #27 | Exceptional 3.43 |
| Immigrants | Latin America | 100.0 /100 | #28 | Exceptional 3.42 |
| Nepalese | 100.0 /100 | #29 | Exceptional 3.42 |
| Samoans | 100.0 /100 | #30 | Exceptional 3.42 |
| Central Americans | 100.0 /100 | #31 | Exceptional 3.41 |
| Immigrants | Guatemala | 100.0 /100 | #32 | Exceptional 3.41 |
| Hawaiians | 100.0 /100 | #33 | Exceptional 3.41 |
| Hispanics or Latinos | 100.0 /100 | #34 | Exceptional 3.41 |
| Guatemalans | 100.0 /100 | #35 | Exceptional 3.40 |
| Immigrants | Guyana | 100.0 /100 | #36 | Exceptional 3.40 |
| Guyanese | 100.0 /100 | #37 | Exceptional 3.40 |
Demographics Similar to Immigrants from Morocco by Average Family Size
In terms of average family size, the demographic groups most similar to Immigrants from Morocco are Immigrants from India (3.21, a difference of 0.0%), Immigrants from Nepal (3.21, a difference of 0.010%), Immigrants from Kenya (3.21, a difference of 0.020%), Hmong (3.21, a difference of 0.060%), and Immigrants from Poland (3.20, a difference of 0.060%).
| Demographics | Rating | Rank | Average Family Size |
| Immigrants | Sudan | 29.1 /100 | #194 | Fair 3.22 |
| Choctaw | 28.3 /100 | #195 | Fair 3.21 |
| Senegalese | 28.2 /100 | #196 | Fair 3.21 |
| Kenyans | 28.0 /100 | #197 | Fair 3.21 |
| Immigrants | Azores | 21.7 /100 | #198 | Fair 3.21 |
| Hmong | 20.7 /100 | #199 | Fair 3.21 |
| Immigrants | Kenya | 19.2 /100 | #200 | Poor 3.21 |
| Immigrants | Morocco | 18.5 /100 | #201 | Poor 3.21 |
| Immigrants | India | 18.5 /100 | #202 | Poor 3.21 |
| Immigrants | Nepal | 18.1 /100 | #203 | Poor 3.21 |
| Immigrants | Poland | 16.6 /100 | #204 | Poor 3.20 |
| Paraguayans | 16.3 /100 | #205 | Poor 3.20 |
| Immigrants | Cabo Verde | 16.0 /100 | #206 | Poor 3.20 |
| Filipinos | 13.6 /100 | #207 | Poor 3.20 |
| Chippewa | 13.3 /100 | #208 | Poor 3.20 |