Immigrants from Middle Africa vs Immigrants from Morocco Male Poverty
COMPARE
Immigrants from Middle Africa
Immigrants from Morocco
Male Poverty
Male Poverty Comparison
Immigrants from Middle Africa
Immigrants from Morocco
12.7%
MALE POVERTY
0.4/ 100
METRIC RATING
240th/ 347
METRIC RANK
11.3%
MALE POVERTY
40.1/ 100
METRIC RATING
180th/ 347
METRIC RANK
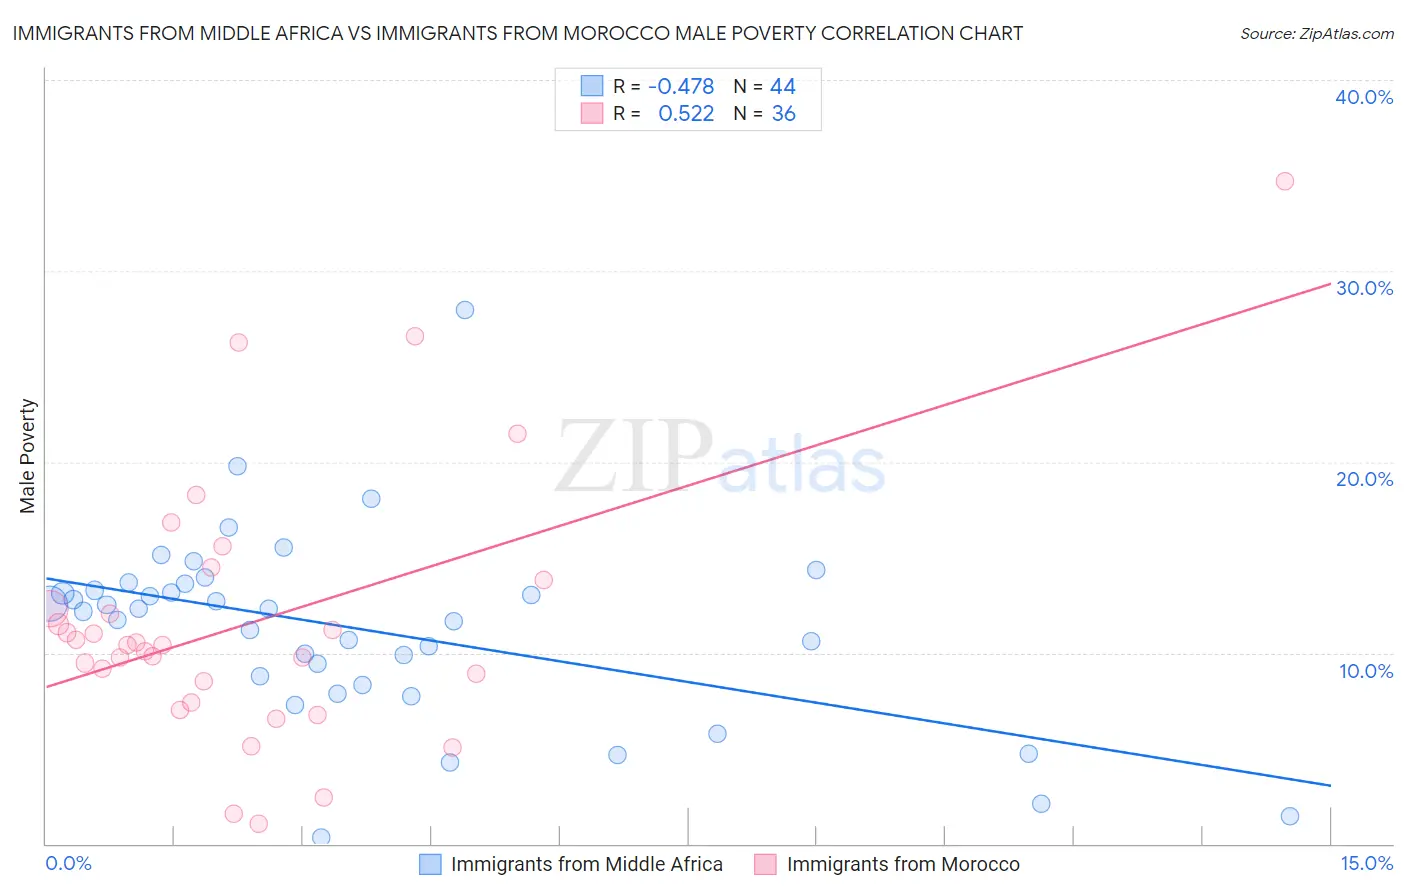
Immigrants from Middle Africa vs Immigrants from Morocco Male Poverty Correlation Chart
The statistical analysis conducted on geographies consisting of 202,607,111 people shows a moderate negative correlation between the proportion of Immigrants from Middle Africa and poverty level among males in the United States with a correlation coefficient (R) of -0.478 and weighted average of 12.7%. Similarly, the statistical analysis conducted on geographies consisting of 178,894,090 people shows a substantial positive correlation between the proportion of Immigrants from Morocco and poverty level among males in the United States with a correlation coefficient (R) of 0.522 and weighted average of 11.3%, a difference of 12.6%.
Male Poverty Correlation Summary
| Measurement | Immigrants from Middle Africa | Immigrants from Morocco |
| Minimum | 0.33% | 1.1% |
| Maximum | 28.0% | 34.7% |
| Range | 27.6% | 33.6% |
| Mean | 11.3% | 11.6% |
| Median | 12.3% | 10.4% |
| Interquartile 25% (IQ1) | 8.6% | 8.0% |
| Interquartile 75% (IQ3) | 13.4% | 13.0% |
| Interquartile Range (IQR) | 4.9% | 5.1% |
| Standard Deviation (Sample) | 5.0% | 6.9% |
| Standard Deviation (Population) | 4.9% | 6.8% |
Similar Demographics by Male Poverty
Demographics Similar to Immigrants from Middle Africa by Male Poverty
In terms of male poverty, the demographic groups most similar to Immigrants from Middle Africa are Ghanaian (12.7%, a difference of 0.27%), Ecuadorian (12.7%, a difference of 0.28%), French American Indian (12.7%, a difference of 0.31%), Immigrants from Saudi Arabia (12.7%, a difference of 0.35%), and Sudanese (12.8%, a difference of 0.36%).
| Demographics | Rating | Rank | Male Poverty |
| Fijians | 0.6 /100 | #233 | Tragic 12.6% |
| Immigrants | Armenia | 0.6 /100 | #234 | Tragic 12.6% |
| Immigrants | Laos | 0.5 /100 | #235 | Tragic 12.6% |
| Immigrants | Saudi Arabia | 0.4 /100 | #236 | Tragic 12.7% |
| French American Indians | 0.4 /100 | #237 | Tragic 12.7% |
| Ecuadorians | 0.4 /100 | #238 | Tragic 12.7% |
| Ghanaians | 0.4 /100 | #239 | Tragic 12.7% |
| Immigrants | Middle Africa | 0.4 /100 | #240 | Tragic 12.7% |
| Sudanese | 0.3 /100 | #241 | Tragic 12.8% |
| Nepalese | 0.3 /100 | #242 | Tragic 12.8% |
| Alaskan Athabascans | 0.3 /100 | #243 | Tragic 12.8% |
| Tsimshian | 0.3 /100 | #244 | Tragic 12.8% |
| Liberians | 0.3 /100 | #245 | Tragic 12.8% |
| Immigrants | El Salvador | 0.2 /100 | #246 | Tragic 12.8% |
| Immigrants | Western Africa | 0.2 /100 | #247 | Tragic 12.9% |
Demographics Similar to Immigrants from Morocco by Male Poverty
In terms of male poverty, the demographic groups most similar to Immigrants from Morocco are Immigrants from Syria (11.3%, a difference of 0.010%), Immigrants from Costa Rica (11.3%, a difference of 0.060%), Mongolian (11.3%, a difference of 0.11%), Kenyan (11.3%, a difference of 0.17%), and Immigrants from South America (11.3%, a difference of 0.33%).
| Demographics | Rating | Rank | Male Poverty |
| Pennsylvania Germans | 50.5 /100 | #173 | Average 11.2% |
| Immigrants | Oceania | 50.0 /100 | #174 | Average 11.2% |
| Celtics | 47.5 /100 | #175 | Average 11.2% |
| Immigrants | Fiji | 46.0 /100 | #176 | Average 11.2% |
| Lebanese | 45.6 /100 | #177 | Average 11.2% |
| Immigrants | Cameroon | 44.5 /100 | #178 | Average 11.2% |
| Immigrants | Syria | 40.3 /100 | #179 | Average 11.3% |
| Immigrants | Morocco | 40.1 /100 | #180 | Average 11.3% |
| Immigrants | Costa Rica | 39.5 /100 | #181 | Fair 11.3% |
| Mongolians | 39.0 /100 | #182 | Fair 11.3% |
| Kenyans | 38.4 /100 | #183 | Fair 11.3% |
| Immigrants | South America | 36.9 /100 | #184 | Fair 11.3% |
| Immigrants | Afghanistan | 33.3 /100 | #185 | Fair 11.4% |
| Immigrants | Sierra Leone | 32.9 /100 | #186 | Fair 11.4% |
| Immigrants | Iraq | 31.9 /100 | #187 | Fair 11.4% |