Soviet Union vs Immigrants from Morocco Male Poverty
COMPARE
Soviet Union
Immigrants from Morocco
Male Poverty
Male Poverty Comparison
Soviet Union
Immigrants from Morocco
11.1%
MALE POVERTY
60.3/ 100
METRIC RATING
160th/ 347
METRIC RANK
11.3%
MALE POVERTY
40.1/ 100
METRIC RATING
180th/ 347
METRIC RANK
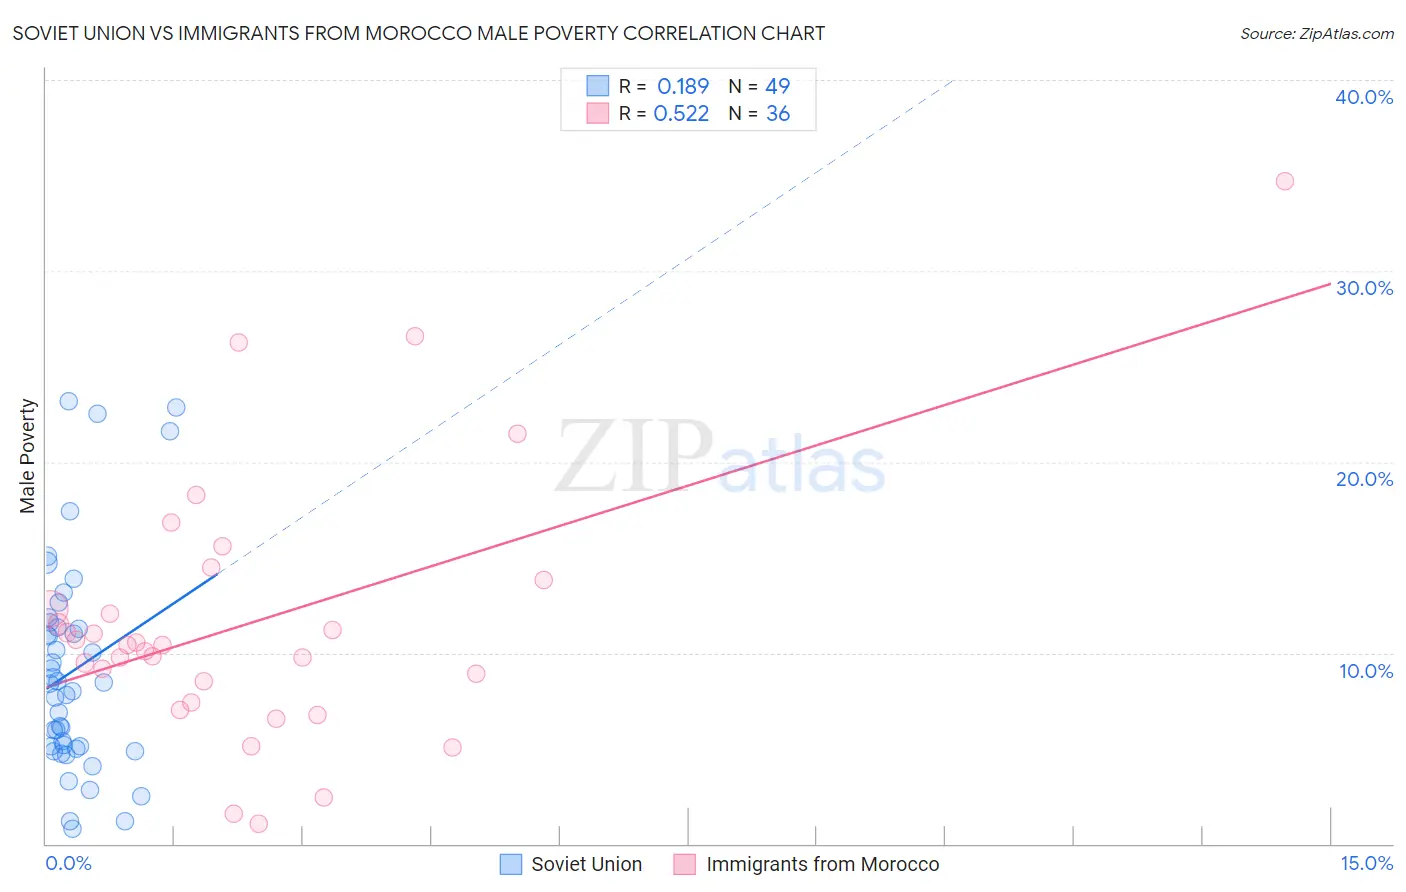
Soviet Union vs Immigrants from Morocco Male Poverty Correlation Chart
The statistical analysis conducted on geographies consisting of 43,503,005 people shows a poor positive correlation between the proportion of Soviet Union and poverty level among males in the United States with a correlation coefficient (R) of 0.189 and weighted average of 11.1%. Similarly, the statistical analysis conducted on geographies consisting of 178,894,090 people shows a substantial positive correlation between the proportion of Immigrants from Morocco and poverty level among males in the United States with a correlation coefficient (R) of 0.522 and weighted average of 11.3%, a difference of 2.0%.
Male Poverty Correlation Summary
| Measurement | Soviet Union | Immigrants from Morocco |
| Minimum | 0.80% | 1.1% |
| Maximum | 23.2% | 34.7% |
| Range | 22.4% | 33.6% |
| Mean | 9.1% | 11.6% |
| Median | 8.4% | 10.4% |
| Interquartile 25% (IQ1) | 5.0% | 8.0% |
| Interquartile 75% (IQ3) | 11.5% | 13.0% |
| Interquartile Range (IQR) | 6.4% | 5.1% |
| Standard Deviation (Sample) | 5.6% | 6.9% |
| Standard Deviation (Population) | 5.5% | 6.8% |
Demographics Similar to Soviet Union and Immigrants from Morocco by Male Poverty
In terms of male poverty, the demographic groups most similar to Soviet Union are Immigrants from Northern Africa (11.1%, a difference of 0.070%), Immigrants from Chile (11.1%, a difference of 0.30%), White/Caucasian (11.1%, a difference of 0.37%), Ethiopian (11.1%, a difference of 0.37%), and Immigrants from Spain (11.1%, a difference of 0.49%). Similarly, the demographic groups most similar to Immigrants from Morocco are Immigrants from Syria (11.3%, a difference of 0.010%), Immigrants from Cameroon (11.2%, a difference of 0.44%), Lebanese (11.2%, a difference of 0.55%), Immigrants from Fiji (11.2%, a difference of 0.59%), and Celtic (11.2%, a difference of 0.73%).
| Demographics | Rating | Rank | Male Poverty |
| Soviet Union | 60.3 /100 | #160 | Good 11.1% |
| Immigrants | Northern Africa | 59.7 /100 | #161 | Average 11.1% |
| Immigrants | Chile | 57.4 /100 | #162 | Average 11.1% |
| Whites/Caucasians | 56.7 /100 | #163 | Average 11.1% |
| Ethiopians | 56.7 /100 | #164 | Average 11.1% |
| Immigrants | Spain | 55.5 /100 | #165 | Average 11.1% |
| Immigrants | Albania | 55.3 /100 | #166 | Average 11.1% |
| Hungarians | 55.1 /100 | #167 | Average 11.1% |
| Immigrants | Portugal | 54.9 /100 | #168 | Average 11.1% |
| Immigrants | Colombia | 54.2 /100 | #169 | Average 11.1% |
| South Americans | 53.8 /100 | #170 | Average 11.1% |
| Uruguayans | 51.0 /100 | #171 | Average 11.2% |
| Immigrants | Ethiopia | 50.7 /100 | #172 | Average 11.2% |
| Pennsylvania Germans | 50.5 /100 | #173 | Average 11.2% |
| Immigrants | Oceania | 50.0 /100 | #174 | Average 11.2% |
| Celtics | 47.5 /100 | #175 | Average 11.2% |
| Immigrants | Fiji | 46.0 /100 | #176 | Average 11.2% |
| Lebanese | 45.6 /100 | #177 | Average 11.2% |
| Immigrants | Cameroon | 44.5 /100 | #178 | Average 11.2% |
| Immigrants | Syria | 40.3 /100 | #179 | Average 11.3% |
| Immigrants | Morocco | 40.1 /100 | #180 | Average 11.3% |