Nicaraguan vs Immigrants from Ghana Male Poverty
COMPARE
Nicaraguan
Immigrants from Ghana
Male Poverty
Male Poverty Comparison
Nicaraguans
Immigrants from Ghana
12.6%
MALE POVERTY
0.6/ 100
METRIC RATING
232nd/ 347
METRIC RANK
12.9%
MALE POVERTY
0.2/ 100
METRIC RATING
253rd/ 347
METRIC RANK
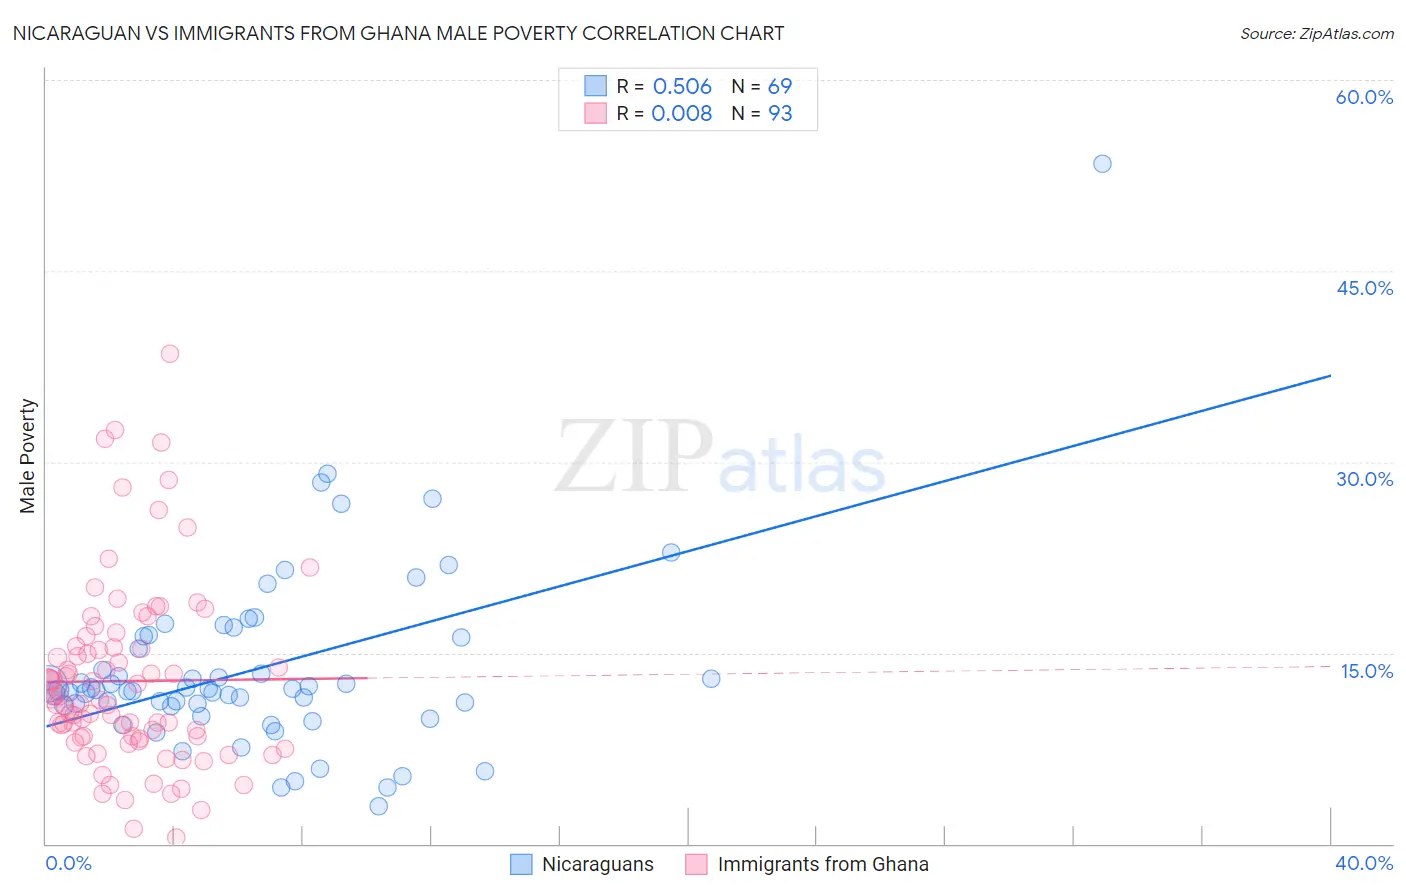
Nicaraguan vs Immigrants from Ghana Male Poverty Correlation Chart
The statistical analysis conducted on geographies consisting of 285,585,810 people shows a substantial positive correlation between the proportion of Nicaraguans and poverty level among males in the United States with a correlation coefficient (R) of 0.506 and weighted average of 12.6%. Similarly, the statistical analysis conducted on geographies consisting of 199,744,013 people shows no correlation between the proportion of Immigrants from Ghana and poverty level among males in the United States with a correlation coefficient (R) of 0.008 and weighted average of 12.9%, a difference of 2.8%.
Male Poverty Correlation Summary
| Measurement | Nicaraguan | Immigrants from Ghana |
| Minimum | 2.9% | 0.51% |
| Maximum | 53.4% | 38.5% |
| Range | 50.5% | 38.0% |
| Mean | 13.7% | 12.8% |
| Median | 12.1% | 11.3% |
| Interquartile 25% (IQ1) | 10.9% | 8.3% |
| Interquartile 75% (IQ3) | 16.3% | 15.5% |
| Interquartile Range (IQR) | 5.4% | 7.2% |
| Standard Deviation (Sample) | 7.3% | 7.2% |
| Standard Deviation (Population) | 7.3% | 7.1% |
Similar Demographics by Male Poverty
Demographics Similar to Nicaraguans by Male Poverty
In terms of male poverty, the demographic groups most similar to Nicaraguans are Fijian (12.6%, a difference of 0.050%), Immigrants from Armenia (12.6%, a difference of 0.11%), Salvadoran (12.6%, a difference of 0.12%), Immigrants from Laos (12.6%, a difference of 0.47%), and Marshallese (12.5%, a difference of 0.68%).
| Demographics | Rating | Rank | Male Poverty |
| Osage | 1.5 /100 | #225 | Tragic 12.3% |
| Nigerians | 1.4 /100 | #226 | Tragic 12.3% |
| Alaska Natives | 1.4 /100 | #227 | Tragic 12.4% |
| Alsatians | 1.3 /100 | #228 | Tragic 12.4% |
| Cubans | 1.3 /100 | #229 | Tragic 12.4% |
| Marshallese | 0.8 /100 | #230 | Tragic 12.5% |
| Salvadorans | 0.6 /100 | #231 | Tragic 12.6% |
| Nicaraguans | 0.6 /100 | #232 | Tragic 12.6% |
| Fijians | 0.6 /100 | #233 | Tragic 12.6% |
| Immigrants | Armenia | 0.6 /100 | #234 | Tragic 12.6% |
| Immigrants | Laos | 0.5 /100 | #235 | Tragic 12.6% |
| Immigrants | Saudi Arabia | 0.4 /100 | #236 | Tragic 12.7% |
| French American Indians | 0.4 /100 | #237 | Tragic 12.7% |
| Ecuadorians | 0.4 /100 | #238 | Tragic 12.7% |
| Ghanaians | 0.4 /100 | #239 | Tragic 12.7% |
Demographics Similar to Immigrants from Ghana by Male Poverty
In terms of male poverty, the demographic groups most similar to Immigrants from Ghana are Immigrants from Ecuador (12.9%, a difference of 0.050%), Immigrants from Cuba (12.9%, a difference of 0.080%), Immigrants from Nicaragua (12.9%, a difference of 0.18%), Potawatomi (12.9%, a difference of 0.19%), and Immigrants from Sudan (12.9%, a difference of 0.27%).
| Demographics | Rating | Rank | Male Poverty |
| Immigrants | El Salvador | 0.2 /100 | #246 | Tragic 12.8% |
| Immigrants | Western Africa | 0.2 /100 | #247 | Tragic 12.9% |
| Immigrants | Sudan | 0.2 /100 | #248 | Tragic 12.9% |
| Potawatomi | 0.2 /100 | #249 | Tragic 12.9% |
| Immigrants | Nicaragua | 0.2 /100 | #250 | Tragic 12.9% |
| Immigrants | Cuba | 0.2 /100 | #251 | Tragic 12.9% |
| Immigrants | Ecuador | 0.2 /100 | #252 | Tragic 12.9% |
| Immigrants | Ghana | 0.2 /100 | #253 | Tragic 12.9% |
| Mexican American Indians | 0.1 /100 | #254 | Tragic 13.0% |
| Immigrants | Liberia | 0.1 /100 | #255 | Tragic 13.0% |
| Immigrants | Burma/Myanmar | 0.1 /100 | #256 | Tragic 13.0% |
| Immigrants | Trinidad and Tobago | 0.1 /100 | #257 | Tragic 13.1% |
| Cape Verdeans | 0.1 /100 | #258 | Tragic 13.1% |
| Cherokee | 0.1 /100 | #259 | Tragic 13.1% |
| Ottawa | 0.1 /100 | #260 | Tragic 13.1% |