Haitian vs Immigrants from Ghana Male Poverty
COMPARE
Haitian
Immigrants from Ghana
Male Poverty
Male Poverty Comparison
Haitians
Immigrants from Ghana
13.7%
MALE POVERTY
0.0/ 100
METRIC RATING
279th/ 347
METRIC RANK
12.9%
MALE POVERTY
0.2/ 100
METRIC RATING
253rd/ 347
METRIC RANK
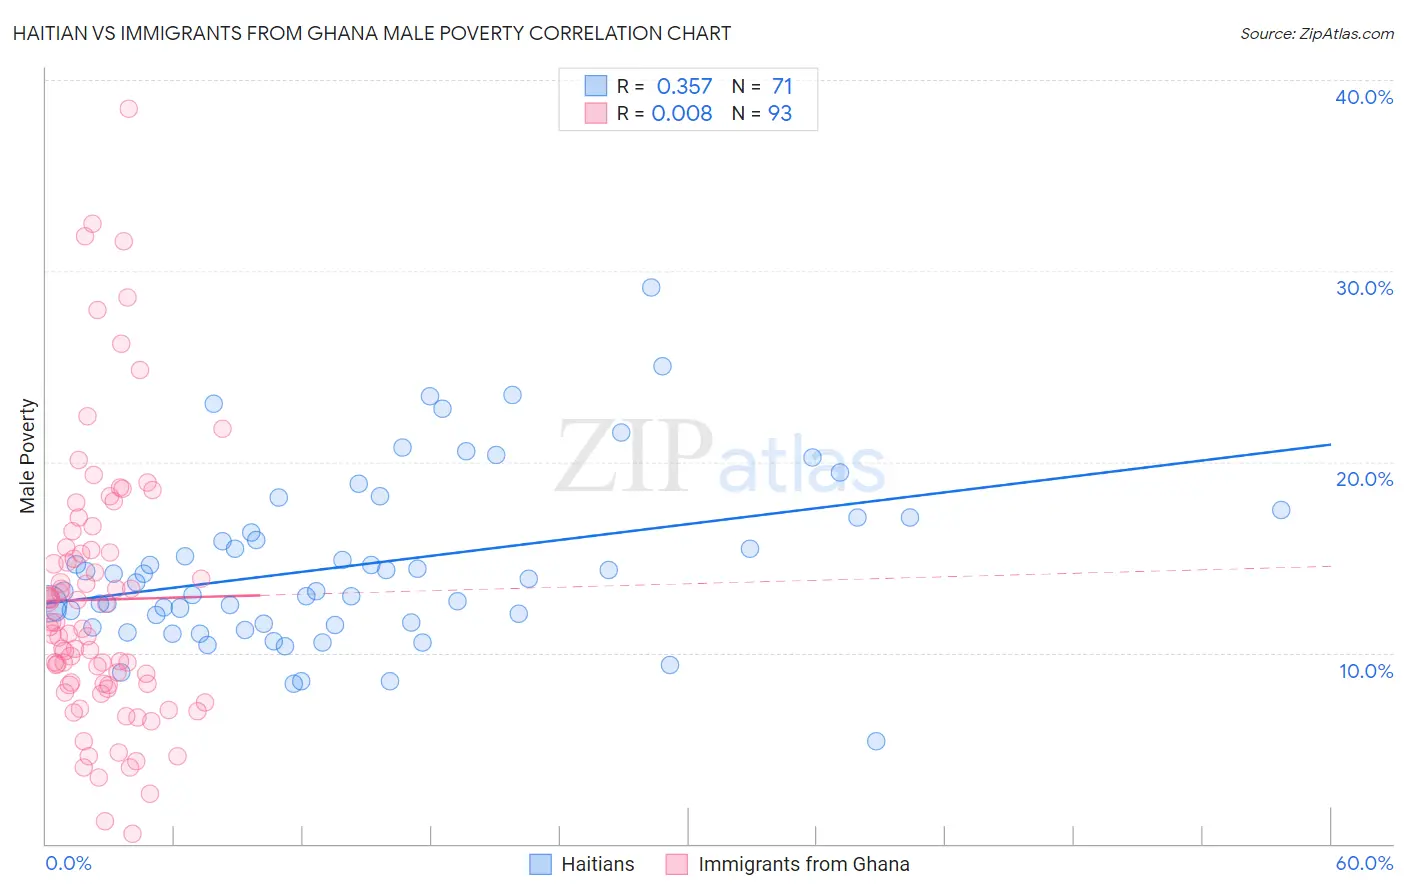
Haitian vs Immigrants from Ghana Male Poverty Correlation Chart
The statistical analysis conducted on geographies consisting of 287,676,273 people shows a mild positive correlation between the proportion of Haitians and poverty level among males in the United States with a correlation coefficient (R) of 0.357 and weighted average of 13.7%. Similarly, the statistical analysis conducted on geographies consisting of 199,744,013 people shows no correlation between the proportion of Immigrants from Ghana and poverty level among males in the United States with a correlation coefficient (R) of 0.008 and weighted average of 12.9%, a difference of 5.7%.
Male Poverty Correlation Summary
| Measurement | Haitian | Immigrants from Ghana |
| Minimum | 5.4% | 0.51% |
| Maximum | 29.1% | 38.5% |
| Range | 23.8% | 38.0% |
| Mean | 14.6% | 12.8% |
| Median | 13.7% | 11.3% |
| Interquartile 25% (IQ1) | 11.5% | 8.3% |
| Interquartile 75% (IQ3) | 17.1% | 15.5% |
| Interquartile Range (IQR) | 5.5% | 7.2% |
| Standard Deviation (Sample) | 4.5% | 7.2% |
| Standard Deviation (Population) | 4.4% | 7.1% |
Similar Demographics by Male Poverty
Demographics Similar to Haitians by Male Poverty
In terms of male poverty, the demographic groups most similar to Haitians are Mexican (13.7%, a difference of 0.090%), Yaqui (13.7%, a difference of 0.14%), Belizean (13.6%, a difference of 0.18%), Bangladeshi (13.6%, a difference of 0.27%), and Immigrants from Cabo Verde (13.7%, a difference of 0.41%).
| Demographics | Rating | Rank | Male Poverty |
| Immigrants | Bahamas | 0.0 /100 | #272 | Tragic 13.5% |
| Chickasaw | 0.0 /100 | #273 | Tragic 13.5% |
| Immigrants | West Indies | 0.0 /100 | #274 | Tragic 13.5% |
| Barbadians | 0.0 /100 | #275 | Tragic 13.6% |
| Immigrants | Latin America | 0.0 /100 | #276 | Tragic 13.6% |
| Bangladeshis | 0.0 /100 | #277 | Tragic 13.6% |
| Belizeans | 0.0 /100 | #278 | Tragic 13.6% |
| Haitians | 0.0 /100 | #279 | Tragic 13.7% |
| Mexicans | 0.0 /100 | #280 | Tragic 13.7% |
| Yaqui | 0.0 /100 | #281 | Tragic 13.7% |
| Immigrants | Cabo Verde | 0.0 /100 | #282 | Tragic 13.7% |
| Comanche | 0.0 /100 | #283 | Tragic 13.8% |
| Immigrants | Haiti | 0.0 /100 | #284 | Tragic 13.8% |
| West Indians | 0.0 /100 | #285 | Tragic 13.8% |
| Shoshone | 0.0 /100 | #286 | Tragic 13.8% |
Demographics Similar to Immigrants from Ghana by Male Poverty
In terms of male poverty, the demographic groups most similar to Immigrants from Ghana are Immigrants from Ecuador (12.9%, a difference of 0.050%), Immigrants from Cuba (12.9%, a difference of 0.080%), Immigrants from Nicaragua (12.9%, a difference of 0.18%), Potawatomi (12.9%, a difference of 0.19%), and Immigrants from Sudan (12.9%, a difference of 0.27%).
| Demographics | Rating | Rank | Male Poverty |
| Immigrants | El Salvador | 0.2 /100 | #246 | Tragic 12.8% |
| Immigrants | Western Africa | 0.2 /100 | #247 | Tragic 12.9% |
| Immigrants | Sudan | 0.2 /100 | #248 | Tragic 12.9% |
| Potawatomi | 0.2 /100 | #249 | Tragic 12.9% |
| Immigrants | Nicaragua | 0.2 /100 | #250 | Tragic 12.9% |
| Immigrants | Cuba | 0.2 /100 | #251 | Tragic 12.9% |
| Immigrants | Ecuador | 0.2 /100 | #252 | Tragic 12.9% |
| Immigrants | Ghana | 0.2 /100 | #253 | Tragic 12.9% |
| Mexican American Indians | 0.1 /100 | #254 | Tragic 13.0% |
| Immigrants | Liberia | 0.1 /100 | #255 | Tragic 13.0% |
| Immigrants | Burma/Myanmar | 0.1 /100 | #256 | Tragic 13.0% |
| Immigrants | Trinidad and Tobago | 0.1 /100 | #257 | Tragic 13.1% |
| Cape Verdeans | 0.1 /100 | #258 | Tragic 13.1% |
| Cherokee | 0.1 /100 | #259 | Tragic 13.1% |
| Ottawa | 0.1 /100 | #260 | Tragic 13.1% |