Finnish vs Immigrants from Ghana Male Poverty
COMPARE
Finnish
Immigrants from Ghana
Male Poverty
Male Poverty Comparison
Finns
Immigrants from Ghana
10.5%
MALE POVERTY
93.4/ 100
METRIC RATING
98th/ 347
METRIC RANK
12.9%
MALE POVERTY
0.2/ 100
METRIC RATING
253rd/ 347
METRIC RANK
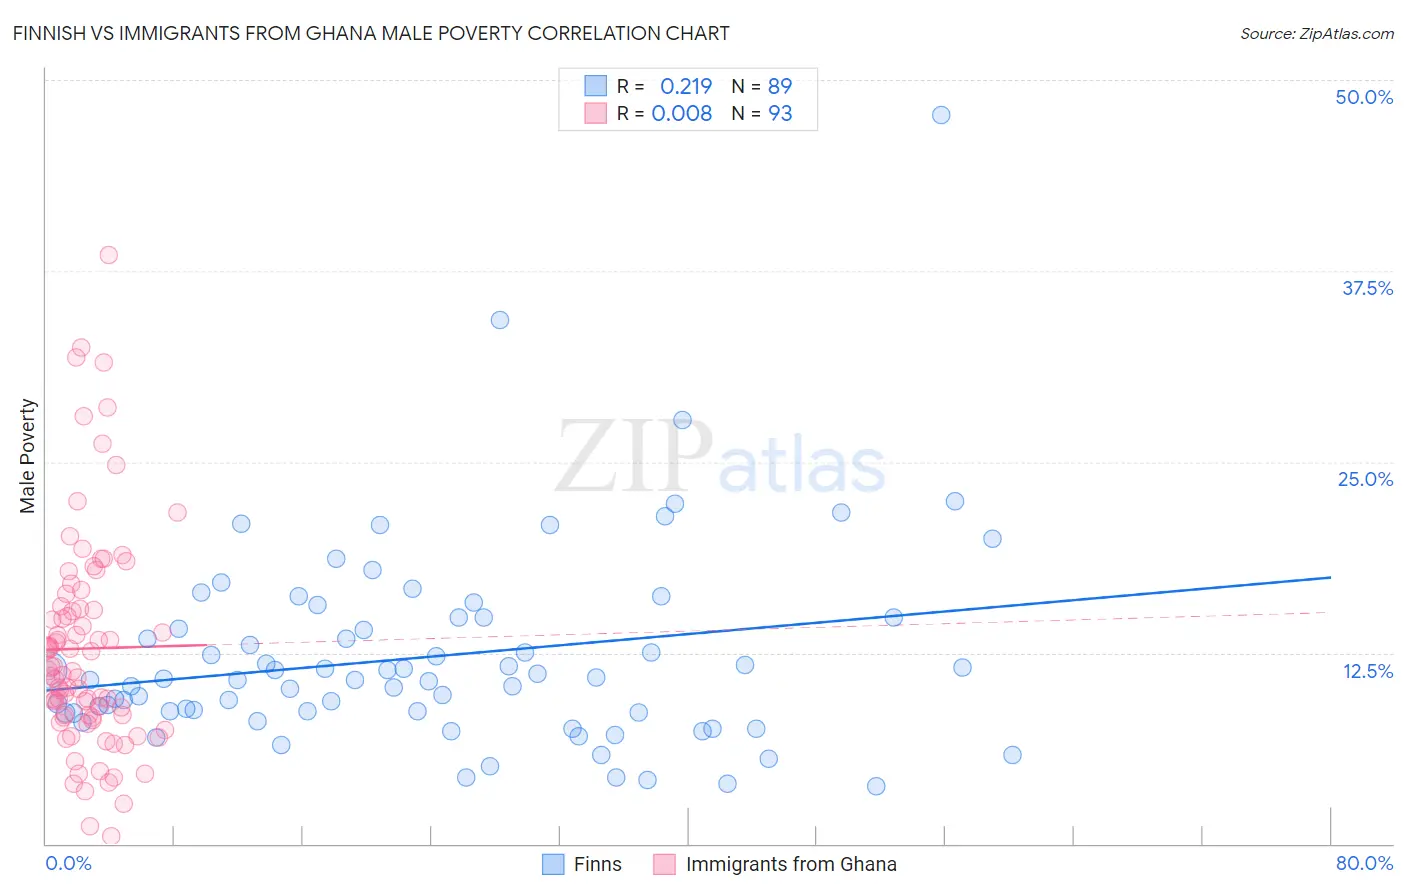
Finnish vs Immigrants from Ghana Male Poverty Correlation Chart
The statistical analysis conducted on geographies consisting of 404,315,970 people shows a weak positive correlation between the proportion of Finns and poverty level among males in the United States with a correlation coefficient (R) of 0.219 and weighted average of 10.5%. Similarly, the statistical analysis conducted on geographies consisting of 199,744,013 people shows no correlation between the proportion of Immigrants from Ghana and poverty level among males in the United States with a correlation coefficient (R) of 0.008 and weighted average of 12.9%, a difference of 23.6%.
Male Poverty Correlation Summary
| Measurement | Finnish | Immigrants from Ghana |
| Minimum | 3.8% | 0.51% |
| Maximum | 47.7% | 38.5% |
| Range | 43.9% | 38.0% |
| Mean | 12.3% | 12.8% |
| Median | 10.8% | 11.3% |
| Interquartile 25% (IQ1) | 8.6% | 8.3% |
| Interquartile 75% (IQ3) | 14.8% | 15.5% |
| Interquartile Range (IQR) | 6.3% | 7.2% |
| Standard Deviation (Sample) | 6.6% | 7.2% |
| Standard Deviation (Population) | 6.6% | 7.1% |
Similar Demographics by Male Poverty
Demographics Similar to Finns by Male Poverty
In terms of male poverty, the demographic groups most similar to Finns are Romanian (10.5%, a difference of 0.060%), Immigrants from Indonesia (10.5%, a difference of 0.060%), Immigrants from Egypt (10.4%, a difference of 0.11%), Scottish (10.4%, a difference of 0.24%), and Immigrants from South Africa (10.4%, a difference of 0.28%).
| Demographics | Rating | Rank | Male Poverty |
| British | 94.8 /100 | #91 | Exceptional 10.4% |
| Jordanians | 94.4 /100 | #92 | Exceptional 10.4% |
| Australians | 94.4 /100 | #93 | Exceptional 10.4% |
| Immigrants | South Africa | 94.1 /100 | #94 | Exceptional 10.4% |
| Scottish | 94.0 /100 | #95 | Exceptional 10.4% |
| Immigrants | Egypt | 93.7 /100 | #96 | Exceptional 10.4% |
| Romanians | 93.6 /100 | #97 | Exceptional 10.5% |
| Finns | 93.4 /100 | #98 | Exceptional 10.5% |
| Immigrants | Indonesia | 93.3 /100 | #99 | Exceptional 10.5% |
| Immigrants | Latvia | 92.8 /100 | #100 | Exceptional 10.5% |
| Immigrants | Zimbabwe | 92.0 /100 | #101 | Exceptional 10.5% |
| French Canadians | 91.9 /100 | #102 | Exceptional 10.5% |
| Slavs | 91.7 /100 | #103 | Exceptional 10.5% |
| Welsh | 91.6 /100 | #104 | Exceptional 10.5% |
| Canadians | 91.6 /100 | #105 | Exceptional 10.5% |
Demographics Similar to Immigrants from Ghana by Male Poverty
In terms of male poverty, the demographic groups most similar to Immigrants from Ghana are Immigrants from Ecuador (12.9%, a difference of 0.050%), Immigrants from Cuba (12.9%, a difference of 0.080%), Immigrants from Nicaragua (12.9%, a difference of 0.18%), Potawatomi (12.9%, a difference of 0.19%), and Immigrants from Sudan (12.9%, a difference of 0.27%).
| Demographics | Rating | Rank | Male Poverty |
| Immigrants | El Salvador | 0.2 /100 | #246 | Tragic 12.8% |
| Immigrants | Western Africa | 0.2 /100 | #247 | Tragic 12.9% |
| Immigrants | Sudan | 0.2 /100 | #248 | Tragic 12.9% |
| Potawatomi | 0.2 /100 | #249 | Tragic 12.9% |
| Immigrants | Nicaragua | 0.2 /100 | #250 | Tragic 12.9% |
| Immigrants | Cuba | 0.2 /100 | #251 | Tragic 12.9% |
| Immigrants | Ecuador | 0.2 /100 | #252 | Tragic 12.9% |
| Immigrants | Ghana | 0.2 /100 | #253 | Tragic 12.9% |
| Mexican American Indians | 0.1 /100 | #254 | Tragic 13.0% |
| Immigrants | Liberia | 0.1 /100 | #255 | Tragic 13.0% |
| Immigrants | Burma/Myanmar | 0.1 /100 | #256 | Tragic 13.0% |
| Immigrants | Trinidad and Tobago | 0.1 /100 | #257 | Tragic 13.1% |
| Cape Verdeans | 0.1 /100 | #258 | Tragic 13.1% |
| Cherokee | 0.1 /100 | #259 | Tragic 13.1% |
| Ottawa | 0.1 /100 | #260 | Tragic 13.1% |