Samoan vs Immigrants from El Salvador Child Poverty Among Girls Under 16
COMPARE
Samoan
Immigrants from El Salvador
Child Poverty Among Girls Under 16
Child Poverty Among Girls Under 16 Comparison
Samoans
Immigrants from El Salvador
15.7%
CHILD POVERTY AMONG GIRLS UNDER 16
84.2/ 100
METRIC RATING
146th/ 347
METRIC RANK
20.0%
CHILD POVERTY AMONG GIRLS UNDER 16
0.1/ 100
METRIC RATING
272nd/ 347
METRIC RANK
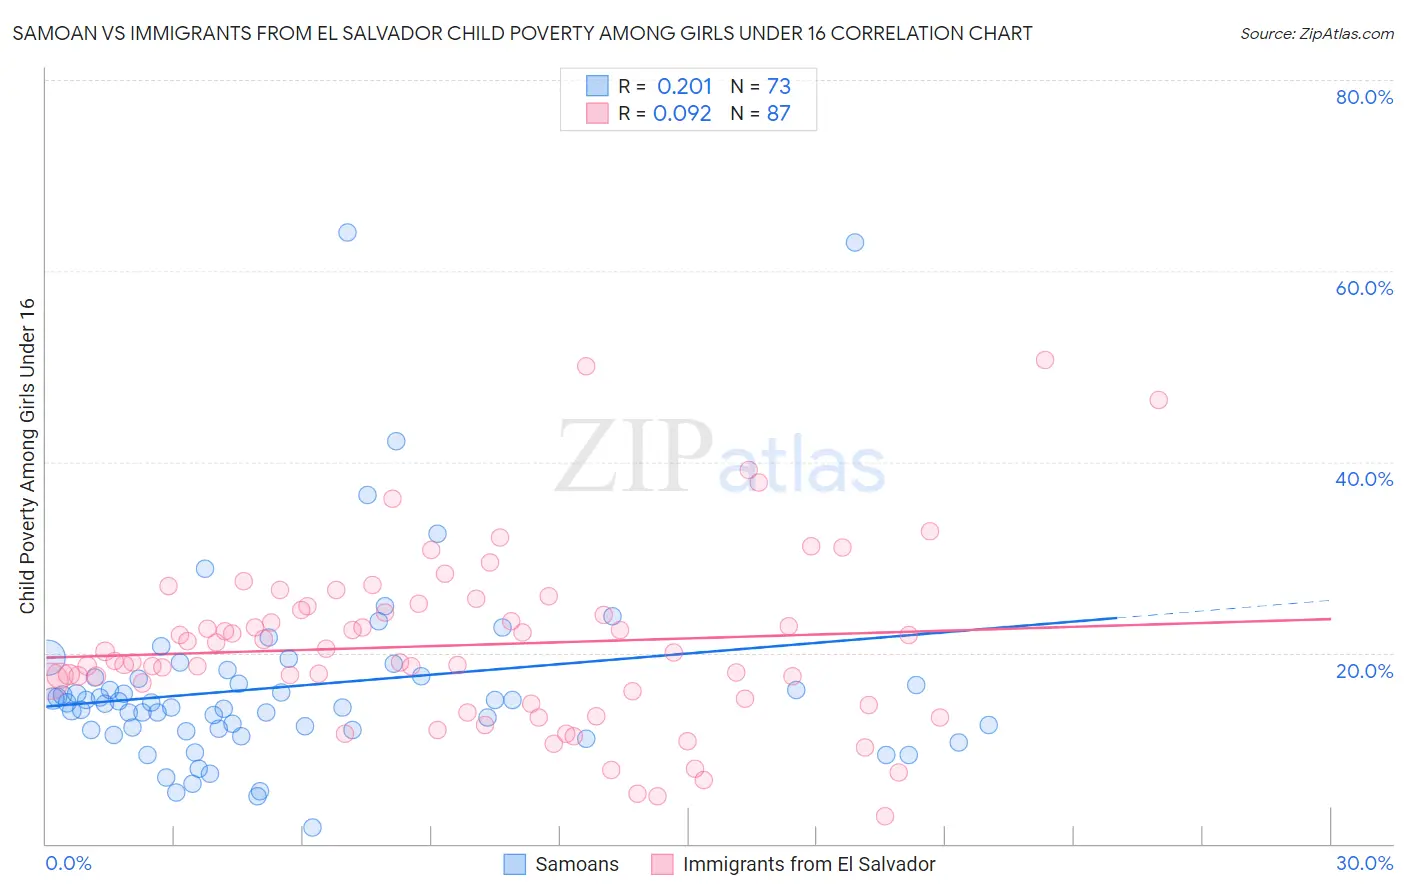
Samoan vs Immigrants from El Salvador Child Poverty Among Girls Under 16 Correlation Chart
The statistical analysis conducted on geographies consisting of 223,807,400 people shows a weak positive correlation between the proportion of Samoans and poverty level among girls under the age of 16 in the United States with a correlation coefficient (R) of 0.201 and weighted average of 15.7%. Similarly, the statistical analysis conducted on geographies consisting of 353,816,537 people shows a slight positive correlation between the proportion of Immigrants from El Salvador and poverty level among girls under the age of 16 in the United States with a correlation coefficient (R) of 0.092 and weighted average of 20.0%, a difference of 27.3%.
Child Poverty Among Girls Under 16 Correlation Summary
| Measurement | Samoan | Immigrants from El Salvador |
| Minimum | 1.7% | 2.8% |
| Maximum | 64.0% | 50.7% |
| Range | 62.3% | 47.8% |
| Mean | 16.5% | 20.8% |
| Median | 14.8% | 20.0% |
| Interquartile 25% (IQ1) | 11.9% | 15.2% |
| Interquartile 75% (IQ3) | 17.5% | 24.9% |
| Interquartile Range (IQR) | 5.5% | 9.8% |
| Standard Deviation (Sample) | 10.3% | 9.1% |
| Standard Deviation (Population) | 10.3% | 9.0% |
Similar Demographics by Child Poverty Among Girls Under 16
Demographics Similar to Samoans by Child Poverty Among Girls Under 16
In terms of child poverty among girls under 16, the demographic groups most similar to Samoans are Slavic (15.7%, a difference of 0.23%), Welsh (15.6%, a difference of 0.29%), Icelander (15.7%, a difference of 0.38%), Israeli (15.6%, a difference of 0.50%), and Immigrants from Peru (15.6%, a difference of 0.59%).
| Demographics | Rating | Rank | Child Poverty Among Girls Under 16 |
| Armenians | 87.9 /100 | #139 | Excellent 15.5% |
| New Zealanders | 87.2 /100 | #140 | Excellent 15.6% |
| Immigrants | Jordan | 87.2 /100 | #141 | Excellent 15.6% |
| Canadians | 87.1 /100 | #142 | Excellent 15.6% |
| Immigrants | Peru | 86.6 /100 | #143 | Excellent 15.6% |
| Israelis | 86.3 /100 | #144 | Excellent 15.6% |
| Welsh | 85.4 /100 | #145 | Excellent 15.6% |
| Samoans | 84.2 /100 | #146 | Excellent 15.7% |
| Slavs | 83.1 /100 | #147 | Excellent 15.7% |
| Icelanders | 82.4 /100 | #148 | Excellent 15.7% |
| Immigrants | Hungary | 80.9 /100 | #149 | Excellent 15.8% |
| Immigrants | Albania | 80.7 /100 | #150 | Excellent 15.8% |
| Venezuelans | 80.1 /100 | #151 | Excellent 15.8% |
| Immigrants | Kuwait | 79.4 /100 | #152 | Good 15.8% |
| Immigrants | Nepal | 78.5 /100 | #153 | Good 15.9% |
Demographics Similar to Immigrants from El Salvador by Child Poverty Among Girls Under 16
In terms of child poverty among girls under 16, the demographic groups most similar to Immigrants from El Salvador are Immigrants from Barbados (19.9%, a difference of 0.11%), Bangladeshi (20.0%, a difference of 0.20%), Cherokee (19.9%, a difference of 0.21%), Liberian (19.9%, a difference of 0.40%), and Spanish American Indian (19.9%, a difference of 0.50%).
| Demographics | Rating | Rank | Child Poverty Among Girls Under 16 |
| Immigrants | Jamaica | 0.1 /100 | #265 | Tragic 19.8% |
| Spanish Americans | 0.1 /100 | #266 | Tragic 19.8% |
| Immigrants | Bangladesh | 0.1 /100 | #267 | Tragic 19.9% |
| Spanish American Indians | 0.1 /100 | #268 | Tragic 19.9% |
| Liberians | 0.1 /100 | #269 | Tragic 19.9% |
| Cherokee | 0.1 /100 | #270 | Tragic 19.9% |
| Immigrants | Barbados | 0.1 /100 | #271 | Tragic 19.9% |
| Immigrants | El Salvador | 0.1 /100 | #272 | Tragic 20.0% |
| Bangladeshis | 0.1 /100 | #273 | Tragic 20.0% |
| Immigrants | St. Vincent and the Grenadines | 0.0 /100 | #274 | Tragic 20.1% |
| Sub-Saharan Africans | 0.0 /100 | #275 | Tragic 20.1% |
| Comanche | 0.0 /100 | #276 | Tragic 20.2% |
| Belizeans | 0.0 /100 | #277 | Tragic 20.2% |
| Barbadians | 0.0 /100 | #278 | Tragic 20.2% |
| Immigrants | Zaire | 0.0 /100 | #279 | Tragic 20.2% |