Samoan vs Immigrants from Argentina Female Poverty
COMPARE
Samoan
Immigrants from Argentina
Female Poverty
Female Poverty Comparison
Samoans
Immigrants from Argentina
13.1%
FEMALE POVERTY
73.6/ 100
METRIC RATING
152nd/ 347
METRIC RANK
12.8%
FEMALE POVERTY
87.0/ 100
METRIC RATING
131st/ 347
METRIC RANK
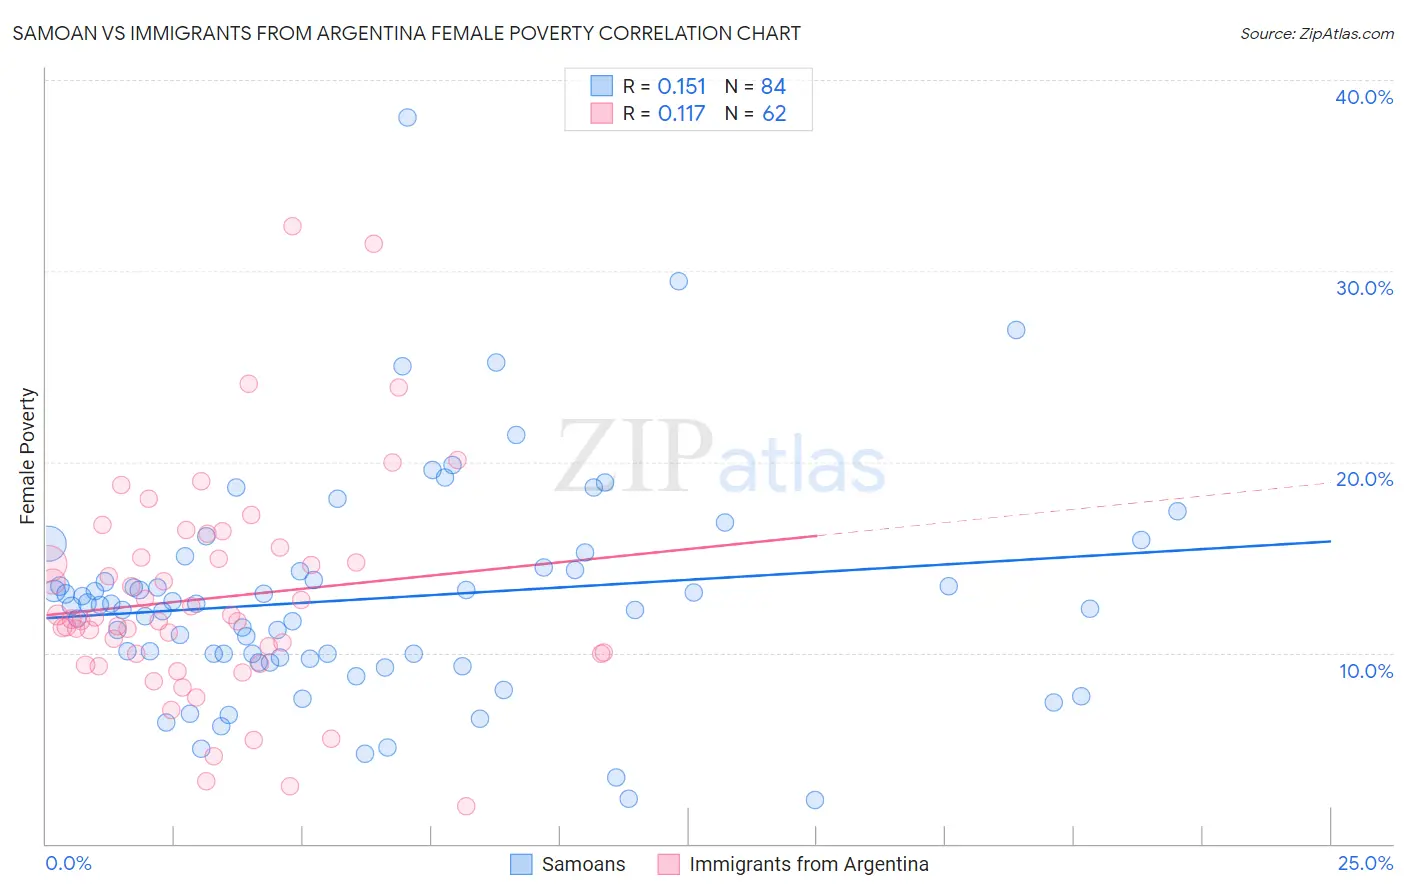
Samoan vs Immigrants from Argentina Female Poverty Correlation Chart
The statistical analysis conducted on geographies consisting of 225,052,897 people shows a poor positive correlation between the proportion of Samoans and poverty level among females in the United States with a correlation coefficient (R) of 0.151 and weighted average of 13.1%. Similarly, the statistical analysis conducted on geographies consisting of 264,332,384 people shows a poor positive correlation between the proportion of Immigrants from Argentina and poverty level among females in the United States with a correlation coefficient (R) of 0.117 and weighted average of 12.8%, a difference of 2.2%.
Female Poverty Correlation Summary
| Measurement | Samoan | Immigrants from Argentina |
| Minimum | 2.3% | 1.9% |
| Maximum | 38.0% | 32.3% |
| Range | 35.7% | 30.4% |
| Mean | 12.8% | 12.9% |
| Median | 12.5% | 11.7% |
| Interquartile 25% (IQ1) | 9.7% | 9.9% |
| Interquartile 75% (IQ3) | 14.4% | 15.0% |
| Interquartile Range (IQR) | 4.7% | 5.0% |
| Standard Deviation (Sample) | 5.8% | 5.7% |
| Standard Deviation (Population) | 5.8% | 5.7% |
Similar Demographics by Female Poverty
Demographics Similar to Samoans by Female Poverty
In terms of female poverty, the demographic groups most similar to Samoans are Immigrants from Germany (13.1%, a difference of 0.17%), Tsimshian (13.1%, a difference of 0.24%), Taiwanese (13.1%, a difference of 0.27%), Immigrants from Fiji (13.2%, a difference of 0.32%), and Armenian (13.2%, a difference of 0.39%).
| Demographics | Rating | Rank | Female Poverty |
| Syrians | 79.6 /100 | #145 | Good 13.0% |
| Immigrants | Peru | 79.1 /100 | #146 | Good 13.0% |
| Immigrants | Kazakhstan | 78.6 /100 | #147 | Good 13.0% |
| Yugoslavians | 76.9 /100 | #148 | Good 13.1% |
| Taiwanese | 75.7 /100 | #149 | Good 13.1% |
| Tsimshian | 75.5 /100 | #150 | Good 13.1% |
| Immigrants | Germany | 74.9 /100 | #151 | Good 13.1% |
| Samoans | 73.6 /100 | #152 | Good 13.1% |
| Immigrants | Fiji | 71.0 /100 | #153 | Good 13.2% |
| Armenians | 70.4 /100 | #154 | Good 13.2% |
| Hungarians | 70.1 /100 | #155 | Good 13.2% |
| Immigrants | Bosnia and Herzegovina | 69.7 /100 | #156 | Good 13.2% |
| Immigrants | Northern Africa | 68.8 /100 | #157 | Good 13.2% |
| Pennsylvania Germans | 67.3 /100 | #158 | Good 13.2% |
| Costa Ricans | 63.6 /100 | #159 | Good 13.3% |
Demographics Similar to Immigrants from Argentina by Female Poverty
In terms of female poverty, the demographic groups most similar to Immigrants from Argentina are Immigrants from Jordan (12.8%, a difference of 0.010%), Immigrants from Vietnam (12.8%, a difference of 0.030%), Immigrants from Western Europe (12.8%, a difference of 0.070%), Immigrants from Brazil (12.8%, a difference of 0.22%), and Immigrants from Switzerland (12.9%, a difference of 0.24%).
| Demographics | Rating | Rank | Female Poverty |
| Immigrants | Norway | 89.3 /100 | #124 | Excellent 12.8% |
| Argentineans | 89.1 /100 | #125 | Excellent 12.8% |
| Immigrants | Ukraine | 88.8 /100 | #126 | Excellent 12.8% |
| South Africans | 88.4 /100 | #127 | Excellent 12.8% |
| Immigrants | Belarus | 88.2 /100 | #128 | Excellent 12.8% |
| Immigrants | Brazil | 87.9 /100 | #129 | Excellent 12.8% |
| Immigrants | Vietnam | 87.1 /100 | #130 | Excellent 12.8% |
| Immigrants | Argentina | 87.0 /100 | #131 | Excellent 12.8% |
| Immigrants | Jordan | 86.9 /100 | #132 | Excellent 12.8% |
| Immigrants | Western Europe | 86.6 /100 | #133 | Excellent 12.8% |
| Immigrants | Switzerland | 85.8 /100 | #134 | Excellent 12.9% |
| French | 85.6 /100 | #135 | Excellent 12.9% |
| Peruvians | 85.2 /100 | #136 | Excellent 12.9% |
| Chileans | 84.7 /100 | #137 | Excellent 12.9% |
| Immigrants | France | 83.6 /100 | #138 | Excellent 12.9% |